Fourteenth Day Enrollment Report
Spring 2011
Published on February 10, 2011
By The Office of Institutional Research
Table of Contents
Page no.
Summary
Enrollment by Gender
1
Enrollment by Ethnicity
2
Enrollment by Age
4
Enrollment by Admission Status
6
Enrollment by Classification
8
Full-time/Part-time Status, Headcount, FTE, SCH
9
Enrollment by Award Sought
11
Enrollment by Division
12
Enrollment by Course Location
13
Enrollment by Online Status
13
Enrollment by Program
14
Enrollment by Program Ranked
16
Enrollment by Parish
17
Enrollment by Zip Code
20
SUMMARY
3
Enrollment increased 12.3% from Spring 2010 (17,208) to Spring 2011 (19,258).
3
3
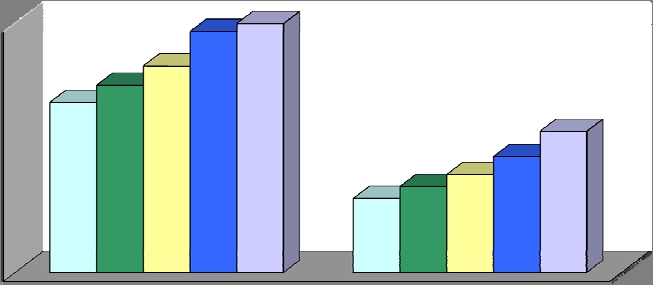
Male students increased by 21.9% from Spring 2010; female students increased by 7.1%.
3
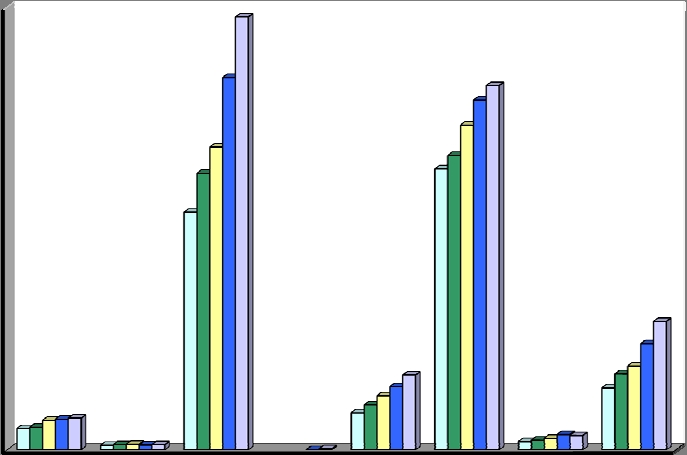
African American enrollment increased by16.3% from Spring 2010.
3
Hispanic enrollment increased 18.4%.
3
Caucasian enrollment increased by 4.2%
3
The Northshore site had the largest increase from Spring 2010 with 9.3% gain in enrollment
and City Park campus increased by 7.7%.
West Bank campus decreased by -0.2% and Charity School of Nursing decreased by -8.1%.
3
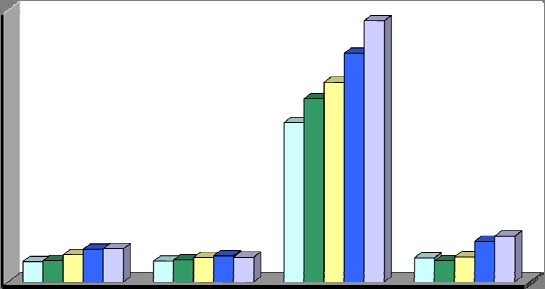
Readmit students increased 12.5% , continuing students increased 14.2%.
3
Pre-Nursing, General Studies, Radiologic Technology, Business Administration and
Business & Management had the largest enrollment in Spring 2011.
African Americans now make up 40.7% of our enrollment, up from Spring 2010 (39%).
4.8% of the increase was a result of the merger with Louisiana Technical College - Region 1, which
became the Technical Division of Delgado on August 25, 2010.
Number % Number %
Change Change Change Change
College Wide
2007 2007 2010 2010
Gender
2007 2008 2009 2010 2011
to 2011 to 2011 to 2011 to 2011
Female
8,205 9,031 9,957 11,621 12,447 4,242 51.7%
826 7.1%
Male
3,575 4,148 4,721 5,587 6,811 3,236 90.5% 1,224 21.9%
Total
11,780 13,179 14,678 17,208 19,258 7,478 63.5% 2,050 11.9%
Percentages
Female
69.7% 68.5% 67.8% 67.5% 64.6%
Male
30.3% 31.5% 32.2% 32.5% 35.4%
Number
%
Number
%
Change
Change
Change
Change
City Park Campus
2007 2007 2010 2010
Gender
2007 2008 2009 2010 2011
to 2011 to 2011 to 2011 to 2011
Female
4,583 5,351 5,843 6,977 7,350 2,767 60.4%
373 5.3%
Male
2,481 2,990 3,214 3,734 4,182 1,701 68.6%
448 12.0%
Total
7,064 8,341 9,057 10,711 11,532 4,468 63.3%
821 7.7%
West Bank Campus
Female
2,001 1,946 2,121 2,261 2,368 367 18.3%
107 4.7%
Male
655 631 853 1,034 920 265 40.5%
-114 -11.0%
Total
2,656 2,577 2,974 3,295 3,288 632 23.8%
-7 -0.2%
Charity School of Nursing
Female
709 654 666 734 685
-24 -3.4%
-49 -6.7%
Male
79 102 104 98 80
1 1.3%
-18 -18.4%
Total
788 756 770 832 765
-23 -2.9%
-67 -8.1%
Northshore Site
Female
912 1,080 1,327 1,649 1,865 953 104.5%
216 13.1%
Male
360 425 550 721 725 365 101.4%
4 0.6%
Total
1,272 1,505 1,877 2,370 2,590 1,318 103.6%
220 9.3%
*Technical Division
Female
179 N/A N/A
N/A N/A
Male
904 N/A N/A
N/A N/A
Total
1,083
N/A N/A
N/A N/A
*Louisiana Technical College, Region 1 is a part of Delgado Community College as of Fall 2010.
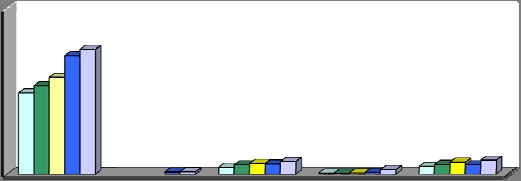
Spring Enrollment History 2007-2011 by Gender
0
2,000
4,000
6,000
8,000
10,000
12,000
Female
Male
Enrollment by Gender
2007
2008
2009
2010
2011
2/10/2011
1
Office of Institutional Research
Number % Number %
Change Change Change Change
College Wide
2007 2007 2010 2010
Ethnicity
2007 2008 2009 2010 2011
to 2011 to 2011 to 2011 to 2011
Asian
383 405 532 552 571 188 49.1%
19 3.4%
Native American
81 92 98 86 92
11 13.6%
6 7.0%
Black Non-Hispanic
4,297 5,002 5,476 6,737 7,832 3,535 82.3% 1,095 16.3%
Hawaiian-Pacific Islander
0 19 N/A N/A
19 0.0%
Hispanic 668 810 976 1,142 1,352 684 102.4%
210 18.4%
White Non-Hispanic
5,082 5,326 5,874 6,326 6,591 1,509 29.7%
265 4.2%
Non Resident Alien
147 172 206 276 256 109 74.1%
-20 -7.2%
Did not indicate
1,122 1,372 1,516 1,918 2,320 1,198 106.8%
402 21.0%
Two or more races
171 225 N/A N/A
54 31.6%
Total
11,780 13,179 14,678 17,208 19,258 7,478 63.5% 2,050 11.9%
Percentages
Asian
3%
3%
4%
3% 3.0%
Native American
1% 1% 1% 0% 0.5%
Black Non-Hispanic
36% 38% 37% 39% 40.7%
Hawaiian-Pacific
Islander 0%
0%
0%
0% 0.1%
Hispanic 6% 6% 7% 7% 7.0%
White Non-Hispanic
43% 40% 40% 37% 34.2%
Non Resident Alien
1% 1% 1% 2% 1.3%
Did not indicate
10% 10% 10% 11% 12.0%
Two
or
more
races
0%
0%
0%
1% 1.2%
Spring Enrollment History 2007-2011 by Ethnicity
0
1,000
2,000
3,000
4,000
5,000
6,000
7,000
8,000
Enrollment by Ethnicity
2007
2008
2009
2010
2011
2/10/2011
2
Office of Institutional Research
Number % Number %
Change Change Change Change
City Park Campus
2007 2007 2010 2010
2007 2008 2009 2010 2011
to 2011 to 2011 to 2011 to 2011
Asian
236 285 371 381 388 152 64.4%
7 1.8%
Native American
47 52 56 51 47
0 0.0%
-4 -7.8%
Black Non-Hispanic
2,526 3,154 3,330 4,250 4803 2,277 90.1%
553 13.0%
Hawaiian-Pacific Islander
13 N/A N/A
N/A N/A
Hispanic
465 603 710 829 943 478 102.8%
114 13.8%
White Non-Hispanic
2,945 3,245 3,480 3,748 3735 790 26.8%
-13 -0.3%
Non Resident Alien
132 164 191 253 231
99 75.0%
-22 -8.7%
Did not indicate
713 838 919 1,101 1244 531 74.5%
143 13.0%
Two or more races
98 128 N/A N/A
30 30.6%
Total
7,064 8,341 9,057 10,711 11,532 4,468 63.3%
821 7.7%
Asian
133 98 126 126 128
-5 -3.8%
2
1.6%
Native American
20 22 21 24 19
-1 -5.0%
-5 -20.8%
Black Non-Hispanic
1,264 1,290 1,547 1,758 1779 515 40.7%
21 1.2%
Hawaiian-Pacific Islander
1 N/A N/A
N/A N/A
Hispanic
125 105 159 190 191
66 52.8%
1 0.5%
White Non-Hispanic
853 743 795 804 690
-163 -19.1% -114 -14.2%
Non Resident Alien
10 3 4 11 12
2 20.0%
1 9.1%
Did not indicate
251 316 322 340 417 166 66.1%
77 22.6%
Two or more races
42 51 N/A N/A
9 21.4%
Total
2,656 2,577 2,974 3,295 3,288 632 23.8%
-7 -0.2%
Charity School of Nursing
Asian
6 10 15 19 15
9 150.0%
-4 -21.1%
Native
American
4
6
6
1 3
-1 -25.0%
2 200.0%
Black Non-Hispanic
232 216 202 211 177
-55 -23.7%
-34 -16.1%
Hawaiian-Pacific Islander
2 N/A N/A
N/A N/A
Hispanic 40 43 47 50 48
8 20.0%
-2 -4.0%
White Non-Hispanic
433 394 428 477 434
1 0.2%
-43 -9.0%
Non Resident Alien
4 4 9 10 9
5 125.0%
-1 -10.0%
Did not indicate
69 83 63 63 72
3 4.3%
9 14.3%
Two or more races
1 5 N/A N/A
4 400.0%
Total
788 756 770 832 765
-23 -2.9%
-67 -8.1%
Northshore Site
Asian
8 12 20 26 20
12 150.0%
-6 -23.1%
Native American
10 12 15 10 13
3 30.0%
3 30.0%
Black Non-Hispanic
275 342 397 518 591 316 114.9%
73 14.1%
Hawaiian-Pacific Islander
1 N/A N/A
N/A N/A
Hispanic
38 59 60 73 102
64 168.4%
29 39.7%
White Non-Hispanic
851 944 1171 1297 1312 461 54.2%
15 1.2%
Non
Resident
Alien
1
1
2
2 3 2 200.0% 1 50.0%
Did not indicate
89 135 212 414 507 418 469.7%
93 22.5%
Two or more races
30 41
N/A N/A
11 36.7%
Total
1,272 1,505 1,877 2,370 2,590 1,276 103.6%
220 9.3%
Technical Division
Asian
20 N/A N/A
N/A N/A
Native American
10 N/A N/A
N/A N/A
Black Non-Hispanic
482 N/A N/A
N/A N/A
Hawaiian-Pacific Islander
2 N/A N/A
N/A N/A
Hispanic
68 N/A N/A
N/A N/A
White Non-Hispanic
420 N/A N/A
N/A N/A
Non Resident Alien
1 N/A N/A
N/A N/A
Did not indicate
80 N/A N/A
N/A N/A
Two or more races
0 N/A N/A
N/A N/A
Total
1,083
N/A N/A
N/A N/A
Spring Enrollment History 2007-2011 by Age
West Bank Campus
2/10/2011
3
Office of Institutional Research
Number
%
Number
%
Change
Change
Change
Change
College Wide
2007
2007
2010
2010
2007
2008
2009
2010
2011
to 2011
to 2011
to 2011
to 2011
Less Than 18
35
28
86
76
55
20
57.1%
-21
-27.6%
18-19
838
1,063
1,194
1,313
1,438
600
71.6%
125
9.5%
20-21
2,342
2,709
2,964
3,544
3,889
1,547
66.1%
345
9.7%
22-24
2,650
2,997
3,286
3,650
3,983
1,333
50.3%
333
9.1%
25-29
2,280
2,546
2,958
3,621
4,129
1,849
81.1%
508
14.0%
30-34
1,221
1,365
1,517
1,868
2,204
983
80.5%
336
18.0%
35-39
906
955
1,002
1,105
1,239
333
36.8%
134
12.1%
40-49
1,054
995
1,101
1,356
1,528
474
45.0%
172
12.7%
50-64
411
467
498
596
707
296
72.0%
111
18.6%
65 and Over
43
54
72
79
86
43
100.0%
7
8.9%
Total
11,780
13,179
14,678
17,208
19,258
7,478
63.5%
2,050
11.9%
Average Age
28
28
28
29
28
Percentages
Less Than 18
0%
0%
1%
0%
0%
18-19
7%
8%
8%
8%
7%
20-21
20%
21%
20%
21%
20%
22-24
22%
23%
22%
21%
21%
25-29
19%
19%
20%
21%
21%
30-34
10%
10%
10%
11%
11%
35-39
8%
7%
7%
6%
6%
40-49
9%
8%
8%
8%
8%
50-64
3%
4%
3%
3%
4%
65 and Over
0%
0%
0%
0%
0%
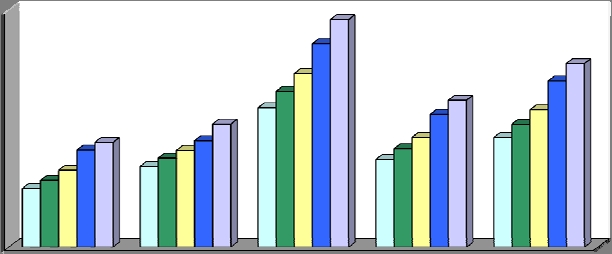
Spring Enrollment History 2007-2011 by Age
0
500
1,000
1,500
2,000
2,500
3,000
3,500
4,000
4,500
Less Than
18
18
-
19
20
-
21
22
-
24
25
-
29
30
-
34
35
-
39
40
-
49
50
-
64
65 and
Over
Enrollment by Age
2007
2008
2009
2010
2011
2/10/2011
4
Office of Institutional Research
Number % Number %
Change Change Change Change
City Park Campus
2007 2007 2010 2010
2007 2008 2009 2010 2011
to 2011 to 2011 to 2011 to 2011
Less Than 18
17 18 72 49 18
1 5.9%
-31 -63.3%
18-19
480 671 788 840 902 422 87.9%
62 7.4%
20-21
1,441 1,683 1,819 2,229 2,448 1,007 69.9%
219 9.8%
22-24
1,700 2,010 2,138 2,345 2,455 755 44.4%
110 4.7%
25-29
1,370 1,627 1,844 2,295 2,471 1,101 80.4%
176 7.7%
30-34
686 843 874 1,113 1,245 559 81.5%
132 11.9%
35-39
499 552 569 650 663 164 32.9%
13 2.0%
40-49
601 606 612 783 873 272 45.3%
90 11.5%
50-64
249 303 303 367 405 156 62.7%
38 10.4%
65 and Over
21 28 38 40 52
31 147.6%
12 30.0%
Total
7,064 8,341 9,057 10,711 11,532 4,468 63.3%
821 7.7%
West Bank Campus
Less Than 18
18 7 13 2 32
14 77.8%
30 1500.0%
18-19
250 260 244 244 279
29 11.6%
35 14.3%
20-21
544 606 655 711 712 168 30.9%
1 0.1%
22-24
544 504 634 670 683 139 25.6%
13 1.9%
25-29
493 454 538 660 643 150 30.4%
-17 -2.6%
30-34
252 246 323 371 349
97 38.5%
-22 -5.9%
35-39
177 187 201 197 204
27 15.3%
7 3.6%
40-49
246 189 228 285 240
-6 -2.4%
-45 -15.8%
50-64
111 100 108 124 120
9 8.1%
-4 -3.2%
65 and Over
21 24 30 31 26
5 23.8%
-5 -16.1%
Total
2,656 2,577 2,974 3,295 3,288 632 23.8%
-7 -0.2%
Charity School of Nursing
Less
Than
18
0
0
0
0 0 N/A N/A N/A N/A
18-19
0
0
0
0 1 1 0.0% 1 0.0%
20-21
8 13 13 16 23
15 187.5%
7 43.8%
22-24
155 162 156 173 142
-13 -8.4%
-31 -17.9%
25-29
214 224 230 265 237
23 10.7%
-28 -10.6%
30-34
156 144 138 134 128
-28 -17.9%
-6 -4.5%
35-39
138 108 98 106 100
-38 -27.5%
-6 -5.7%
40-49
101 90 103 100 101
0 0.0%
1 1.0%
50-64
16 15 32 38 33
17 106.3%
-5 -13.2%
65
and
Over
0
0
0
0 0 N/A N/A N/A N/A
Total
788 756 770 832 765
-23 -2.9%
-67 -8.1%
Northshore Site
Less Than 18
0 3 1 25 2
2 0.0%
-23 -92.0%
18-19
108 132 162 229 204
96 88.9%
-25 -10.9%
20-21
349 407 477 588 588 239 68.5%
0 0.0%
22-24
251 321 358 462 529 278 110.8%
67 14.5%
25-29
203 241 346 401 500 297 146.3%
99 24.7%
30-34
127 132 182 250 301 174 137.0%
51 20.4%
35-39
92 108 134 152 174
82 89.1%
22 14.5%
40-49
106 110 158 188 196
90 84.9%
8 4.3%
50-64
35 49 55 67 92
57 162.9%
25 37.3%
65
and
Over
1
2
4
8 4 3 300.0%
-4 -50.0%
Total
1,272 1,505 1,877 2,370 2,590 1,318 103.6%
220 9.3%
Spring Enrollment History 2007-2011 by Age
2/10/2011
5
Office of Institutional Research
Technical Division
2007 2007 2010 2010
2007 2008 2009 2010 2011
to 2011 to 2011 to 2011 to 2011
Less Than 18
3
18-19
52
20-21
118
22-24
174
25-29
278
30-34
181
35-39
98
40-49
118
50-64
57
65 and Over
4
Total
1,083
Number % Number %
College Wide
Change Change Change Change
2007 2007 2010 2010
2007 2008 2009 2010 2011
to 2011 to 2011 to 2011 to 2011
First-Time Freshmen
1,059 1,098 1,401 1,694 1,718 659 62.2%
24 1.4%
Transfer Student
1,077 1,140 1,275 1,361 1,291 214 19.9%
-70 -5.1%
Continuing Students
8,226 9,461 10,313 11,811 13,491 5,265 64.0% 1,680 14.2%
Readmitted Students
1,251 1,097 1,303 2,104 2,368 1,117 89.3%
264 12.5%
Exchange Students
167 184 263 161 224
57 34.1%
63 39.1%
Other Students
0 199 123 77 166 166 0.0%
89 115.6%
Total
11,780 13,179 14,678 17,208 19,258 7,478 63.5% 2,050 11.9%
Percentages
First-Time Freshmen
9% 8% 10% 10% 9%
Transfer Student
9% 9% 9% 8% 7%
Continuing Students
70% 72% 70% 69% 70%
Readmitted Students
11% 8% 9% 12% 12%
Exchange Students
1% 1% 2% 1% 1%
Other Students
0% 2% 1% 0% 1%
F
all Enrollment History 1997-2000
Spring Enrollment History 2007-2011 by Admission Status
Spring Enrollment History 2007-2011 by Age
0
2,000
4,000
6,000
8,000
10,000
12,000
14,000
First-Time
Freshmen
Transfer
Student
Continuing
Students
Readmitted
Students
Admission Status
2007
2008
2009
2010
2011
2/10/2011
6
Office of Institutional Research
Number % Number %
Change Change Change Change
City Park Campus
2007 2007 2010 2010
2007 2008 2009 2010 2011
to 2011 to 2011 to 2011 to 2011
First-Time Freshmen
625 659 910 960 976 351 56.2%
16 1.7%
Transfer Student
698 725 859 891 857 159 22.8%
-34 -3.8%
Continuing Students
4,843 5,933 6,271 7,385 8,000 3,157 65.2%
615 8.3%
Readmitted Students
786 676 763 1,310 1,539 753 95.8%
229 17.5%
Exchange Students
112 149 207 109 99
-13 -11.6%
-10 -9.2%
Other Students
0 199 47 56 61
61 0.0%
5 8.9%
Total
7,064 8,341 9,057 10,711 11,532 4,468 63.3%
821 7.7%
First-Time Freshmen
261 232 264 382 307
46 17.6%
-75 -19.6%
Transfer Student
208 170 180 192 181
-27 -13.0%
-11 -5.7%
Continuing Students
1,842 1,885 2,076 2,206 2,253 411 22.3%
47 2.1%
Readmitted Students
293 258 331 485 467 174 59.4%
-18 -3.7%
Exchange Students
52 32 47 9 77
25 48.1%
68 755.6%
Other Students
0 0 76 21 3
3 0.0%
-18 -85.7%
Total
2,656 2,577 2,974 3,295 3,288 632 23.8%
-7 -0.2%
Charity School of Nursing
First-Time
Freshmen
1
0
0
0 0
-1 0.0%
0
0.0%
Transfer Student
15 50 5 23 14
-1 -6.7%
-9 -39.1%
Continuing Students
707 668 716 716 699
-8 -1.1%
-17 -2.4%
Readmitted Students
64 38 49 93 52
-12 -18.8%
-41 -44.1%
Exchange
Students
1
0
0
0 0
-1 0.0%
0
0.0%
Other
Students
0
0
0
0 0 0 0.0% 0 0.0%
Total
788 756 770 832 765
-23 -2.9%
-67 -8.1%
Northshore Site
First-Time Freshmen
172 207 227 352 371 199 115.7%
19 5.4%
Transfer Student
156 195 231 255 212
56 35.9%
-43 -16.9%
Continuing Students
834 975 1,250 1,504 1,729 895 107.3%
225 15.0%
Readmitted Students
108 125 160 216 269 161 149.1%
53 24.5%
Exchange Students
2 3 9 43 9
7 350.0%
-34 -79.1%
Other
Students
0
0
0
0 0 0 0.0% 0 0.0%
Total
1,272 1,505 1,877 2,370 2,590 1,318 103.6%
220 9.3%
Technical Division
First-Time Freshmen
64
Transfer Student
27
Continuing Students
810
Readmitted Students
41
Exchange Students
39
Other Students
102
Total
1,083
West Bank Campus
Spring Enrollment History 2007-2011 by Admission Status
2/10/2011
7
Office of Institutional Research
Number % Number %
College Wide
Change Change Change Change
2007 2007 2010 2010
2007 2008 2009 2010 2011
to 2011 to 2011 to 2011 to 2011
Freshmen
6,048 6,738 7,571 9,266 10,716 4,668 77.2% 1,450 15.6%
Sophomore
2,684 3,067 3,398 3,829 4,306 1,622 60.4%
477 12.5%
Other Undergraduates
2,906 3,209 3,473 3,967 4,026 1,120 38.5%
59 1.5%
Preparatory
142 165 236 146 210
68 47.9%
64 43.8%
Total
11,780 13,179 14,678 17,208 19,258 7,478 63.5% 2,050 11.9%
Percentages
Freshmen
51% 51% 52% 54% 56%
Sophomore
23% 23% 23% 22% 22%
Other Undergraduates
25% 24% 24% 23% 21%
Preparatory
1% 1% 2% 1% 1%
Number % Number %
Change Change Change Change
City Park Campus
2007 2007 2010 2010
2007 2008 2009 2010 2011
to 2011 to 2011 to 2011 to 2011
Freshmen
3,616 4,258 4,642 5,584 6,212 2,596 71.8%
628 11.2%
Sophomore
1,698 2,000 2,155 2,548 2,744 1,046 61.6%
196 7.7%
Other Undergraduates
1,655 1,948 2,067 2,484 2,488 833 50.3%
4 0.2%
Preparatory
95 135 193 95 88
-7 -7.4%
-7 -7.4%
Total
7,064 8,341 9,057 10,711 11,532 4,468 63.3%
821 7.7%
West Bank Campus
Freshmen
1,488 1,415 1,693 2,035 1,807 319 21.4%
-228 -11.2%
Sophomore
643 660 713 707 846 203 31.6%
139 19.7%
Other Undergraduates
481 475 533 545 559
78 16.2%
14 2.6%
Preparatory
44 27 35 8 76
32 72.7%
68 850.0%
Total
2,656 2,577 2,974 3,295 3,288 632 23.8%
-7 -0.2%
Charity School of Nursing
Freshmen
9
1
0
1 3
-6 -66.7%
-64 -8.9%
Sophomore
119 110 118 113 108
-11 -9.2%
-5 -4.4%
Other Undergraduates
659 645 652 718 654
-5 -0.8%
-67 -8.1%
Preparatory
1
0
0
0 0
-1 0.0%
0
0.0%
Total
788 756 770 832 765
-23 -2.9%
-67 -8.1%
Northshore Site
Freshmen
935 1,064 1,236 1,646 1,742 807 86.3%
96 5.8%
Sophomore
224 297 412 461 555 331 147.8%
94 20.4%
Other Undergraduates
111 141 221 220 286 175 157.7%
66 30.0%
Preparatory
2 3 8 43 7
5 250.0%
-36 -83.7%
Total
1,272 1,505 1,877 2,370 2,590 1,318 103.6%
220 9.3%
Technical Division
Freshmen
952
Sophomore
53
Other Undergraduates
39
Preparatory
39
Total
1,083
Spring Enrollment History 2007-2011 by Classification
Spring Enrollment History 2007-2011 by Classification
2/10/2011
8
Office of Institutional Research
Number % Number %
Change Change Change Change
College Wide
2007 2007 2010 2010
2007 2008 2009 2010 2011
to 2011 to 2011 to 2011 to 2011
Full Time
4,955 5,647 6,500 8,204 8,850 3,895 78.6%
646 7.9%
Part Time
6,825 7,532 8,178 9,004 10,408 3,583 52.5% 1,404 15.6%
Headcount
11,780 13,179 14,678 17,208 19,258 7,478 63.5% 2,050 11.9%
SCH
111,038 124,724 139,262 168,553 186,269 75,231 67.8% 17,716 10.5%
FTE* Funding (based on 15 SCH)
7,403 8,315 9,284 11,237 12,418 5,015 67.8% 1,181 10.5%
FTE Other (based on 12 SCH)
9,253 10,394 11,605 14,046 15,522 6,269 67.8% 1,476 10.5%
Percentages
Full Time
42% 43% 44% 48% 46%
Part Time
58% 57% 56% 52% 54%
* FTE is calculated by dividing schedule credit hours by 15.
Enrollment Status, Headcount, FTE, SCH
Spring Enrollment History 2007-2011 by Full-time/ Part-time Status
0
2,000
4,000
6,000
8,000
10,000
12,000
14,000
16,000
18,000
20,000
Full Time Part Time Headcount FTE* Funding
(based on 15
SCH)
FTE Other
(based on 12
SCH)
Enrollment Status, Headcount & FTE
2007
2008
2009
2010
2011
0
20,000
40,000
60,000
80,000
100,000
120,000
140,000
160,000
180,000
200,000
Scheduled Credit Hours
2007
2008
2009
2010
2011
2/10/2011
9
Office of Institutional Research
Number % Number %
Change Change Change Change
City Park Campus
2007 2007 2010 2010
2007 2008 2009 2010 2011
to 2011 to 2011 to 2011 to 2011
Full Time
3,121 3,737 4,268 5,263 5,608 2,487 79.7%
345 6.6%
Part Time
3,943 4,604 4,789 5,448 5,924 1,981 50.2%
476 8.7%
Headcount
7,064 8,341 9,057 10,711 11,532 4,468 63.3%
821 7.7%
SCH
67,583 79,385 88,150 106,555 114,082 46,499 68.8% 7,527 7.1%
FTE* Funding (based on 15 SCH)
4,506 5,292 5,877 7,104 7,605 3,100 68.8%
502 7.1%
FTE Other (based on 12 SCH)
5,632 6,615 7,346 8,880 9,507 3,875 68.8%
627 7.1%
West Bank Campus
Full Time
1,102 1,100 1,163 1,484 1,539 437 39.7%
55 3.7%
Part Time
1,554 1,477 1,811 1,811 1,749 195 12.5%
-62 -3.4%
Headcount
2,656 2,577 2,974 3,295 3,288 632 23.8%
-7 -0.2%
SCH
23,920 23,818 25,409 30,343 31,049 7,129 29.8%
706 2.3%
FTE* Funding (based on 15 SCH)
1,595 1,588 1,694 2,023 2,070 475 29.8%
47 2.3%
FTE Other (based on 12 SCH)
1,993 1,985 2,117 2,529 2,587 594 29.8%
59 2.3%
Charity School of Nursing
Full Time
235 195 214 249 192
-43 -18.3%
-57 -22.9%
Part Time
553 561 556 583 573
20 3.6%
-10 -1.7%
Headcount
788 756 770 832 765
-23 -2.9%
-67 -8.1%
SCH
8,081 7,613 8,003 8,509 7,726
-355 -4.4% -783 -9.2%
FTE* Funding (based on 15 SCH)
539 508 534 567 515
-24 -4.4% -52 -9.2%
FTE Other (based on 12 SCH)
673 634 667 709 644
-30 -4.4% -65 -9.2%
Northshore Site
Full Time
497 615 855 1,208 1,292 795 160.0%
84 7.0%
Part Time
775 890 1,022 1,162 1,298 523 67.5%
136 11.7%
Headcount
1,272 1,505 1,877 2,370 2,590 1,318 103.6%
220 9.3%
SCH
11,454 13,908 17,700 23,146 25,343 13,889 121.3% 2,197 9.5%
FTE* Funding (based on 15 SCH)
764 927 1,180 1,543 1,690 926 121.3%
146 9.5%
FTE Other (based on 12 SCH)
955 1,159 1,475 1,929 2,112 1,157 121.3%
183 9.5%
Technical Division
Full Time
219 N/A N/A
N/A N/A
Part Time
864 N/A N/A
N/A N/A
Headcount
1,083 N/A N/A
N/A N/A
SCH
8,069 N/A N/A
N/A N/A
FTE* Funding (based on 15 SCH)
538 N/A N/A
N/A N/A
FTE Other (based on 12 SCH)
672 N/A N/A
N/A N/A
Enrollment Status, Headcount, FTE, SCH
Spring Enrollment History 2007-2011 by Full-time/ Part-time Status
2/10/2011
10
Office of Institutional Research
Number % Number %
Change Change Change Change
College Wide
2007 2007 2010 2010
2007 2008 2009 2010 2011
to 2011 to 2011 to 2011 to 2011
Associate - 2 yr
9,842 10,707 11,737 14,344 15,137 5,295 53.8%
793 5.5%
Post-Associate Cert
270 300
30 11.1%
Certificate - 1 yr
848 1,137 1,304 1,236 1,544 696 82.1%
308 24.9%
Diploma
145 138 165 219 571 426 293.8%
352 160.7%
Non-degree seeking
945 1,197 1,472 1,139 1,706 761 80.5%
567 49.8%
Total
11,780 13,179 14,678 17,208 19,258 7,478 63.5% 2,050 11.9%
Number % Number %
Change Change Change Change
City Park Campus
2007 2007 2010 2010
2007 2008 2009 2010 2011
to 2011 to 2011 to 2011 to 2011
Associate - 2 yr
5,688 6,458 7,108 8,740 9,383 3,695 65.0%
643 7.4%
Post-Associate Cert
197 203
6 3.0%
Certificate - 1 yr
621 826 907 876 970 349 56.2%
94 10.7%
Diploma
42
54
51
85 142 100 238.1% 57 67.1%
Non-degree seeking
713 1,003 991 813 834 121 17.0%
21 2.6%
Total
7,064 8,341 9,057 10,711 11,532 4,468 63.3%
821 7.7%
West Bank Campus
Associate - 2 yr
2,251 2,193 2,280 2,768 2,798 547 24.3%
30 1.1%
Post-Associate Cert
40 40
0 0.0%
Certificate - 1 yr
175 188 210 199 229
54 30.9%
30 15.1%
Diploma
41
33
35
33 54 13 31.7% 21 63.6%
Non-degree seeking
189 163 449 255 167
-22 -11.6%
-88 -34.5%
Total
2,656 2,577 2,974 3,295 3,288 632 23.8%
-7 -0.2%
Charity School of Nursing
Associate - 2 yr
740 713 702 753 646
-94
-12.7% -107
-14.2%
Post-Associate Cert
0 0
0 0.0%
Certificate
-
1
yr
0
0
0
0 0 0 0.0% 0 0.0%
Diploma
48 42 68 79 119
71 147.9%
40 50.6%
Non-degree
seeking
0
1
0
0 0 0 0.0% 0 0.0%
Total
788 756 770 832 765
-23 -2.9%
-67 -8.1%
Northshore Site
Associate - 2 yr
1,163 1,343 1,647 2,083 2,304 1,141 98.1%
221 10.6%
Post-Associate Cert
33 57
24 72.7%
Certificate - 1 yr
52 123 187 161 169 117 225.0%
8 5.0%
Diploma
14 9 11 22 27
13 92.9%
5 22.7%
Non-degree seeking
43 30 32 71 33
-10 -23.3%
-38 -53.5%
Total
1,272 1,505 1,877 2,370 2,590 1,318 103.6%
220 9.3%
Technical Division
Associate - 2 yr
6 N/A N/A
N/A N/A
Post-Associate Cert
0
Certificate - 1 yr
176 N/A N/A
N/A N/A
Diploma
229 N/A N/A
N/A N/A
Non-degree seeking
672 N/A N/A
N/A N/A
Total
1,083
N/A N/A
N/A N/A
Spring Enrollment History 2007-2011 by Award Sought
0
5,000
10,000
15,000
20,000
A
ssociate - 2
yr
Post-
Associate Cert
Certificate - 1
yr
Diploma Non-degree
seeking
Award Level
2007
2008
2009
2010
2011
2/10/2011
11
Office of Institutional Research
Number % Number %
Change Change Change Change
One College Divisions
2007 2007 2010 2010
2007 2008 2009 2010 2011
to 2011 to 2011 to 2011 to 2011
Allied Health
2,225 2,476 2,650
3,6
32
3
,910
1
,6 75.7%
278 7.7%
Arts & Humanities
2,652 3,064 3,415 3,724 4,221 1,569 59.2%
497 13.3%
Business and Technology
2,936 3,418 3,986 4,535 4,746 1,810 61.6%
211 4.7%
Communication
295 348 462 394 486 191 64.7%
92 23.4%
Nursing
886 852 865 969 765
-121 -13.7% -204 -21.1%
Science & Math
2,786 3,021 3,30
0 3,
9
54
4,
045
1
,259
4
5.2%
91
2.3
%
Tech
nica
l Division
1,085
College Total
11,780 13,179 14,678 17,208 19,258
7,478 63.5% 2,050 11.9%
Spring Enrollment History 2007-2011 by Division
3,910
4,221
4,746
486
765
4,045
1,085
Spring 2011
Allied Health
Arts & Humanities
Business and Technology
Communication
Nursing
Science & Math
Technical Division
2/10/2011
12
Office of Institutional Research
Number % Number %
Course Location Enrollment
Change Change Change Change
2007 2007 2010 2010
2007 2008 2009 2010 2011
to 2011 to 2011 to 2011 to 2011
City Park Campus
7,638
8,948
9,789
11,586
12,570 4,932 64.6%
984 8.5%
West Bank Campus
3,339
3,350
3,806
4,293
4,234 895 26.8%
-59 -1.4%
Charity School of Nursing
788
757 790 856
790
2 0.3%
-66 -7.7%
Northshore Site
1,479
1,857
2,223
2,865
3
,
030 1
,
551 104.9
%
165 5.
8%
Technical Division
1,228
Note: Student enrollment by course location is an unduplicated enrollment count based on the location of
of courses taken that semester. The combined figures will not equal the college-wide total.
Number % Number %
Change Change Change Change
College Wide
2007 2007 2010 2010
2007 2008 2009 2010 2011
to 2011 to 2011 to 2011 to 2011
No. of students taking a web class
3,460 3,474 4,022 4,620 4,886 1,426 41.2%
266 5.8%
St
udents taking only web
18 17 72 91 118 100 559.0%
27 29.8%
Average no. of web courses taken
1.8 1.8 1.7 1.7 1.8
0 0.7%
0 0.
0%
Students in only F2F classes 8,087 9,554 10,440 12,438 13,299 5,212 64.4%
861 6.9%
Total
11,780 13,179 14,678 17,208 19,258 7,478 63.5% 2,050 11.9%
Note: F2F = Face to Face
Percentages
Students taking a web class 29.4% 26.4% 27.4% 26.8% 25.4%
Students taking only web
0.2% 0.1% 0.5% 0.5% 0.6%
Average no. of web courses taken
Students in only F2F classes 68.7% 72.5% 71.1% 72.3% 69.1%
Note: Percentages will not add up to 100%.
2007 2007 2010 2010
City Park
2007 2008 2009 2010 2011
to 2011 to 2011 to 2011 to 2011
No. of students taking a web class
1,805 2,195 2,188 2,844 2,811 1,006 55.7%
-33 -1.
2%
Students taking only web
526 582 532 658 758 232 44.1%
100 15.2%
Average no. of web courses taken
1.9
1.8
1.8
1.8 1.8
0 -2.7%
0.
0 0.0%
Students in only F2F classes 5,259 6,146 6,869 7,867 8,721 3,462 65.8%
854 10.9%
Total
7,064 8,341 9,057 10,711 11,532 4,468 63.3%
821 7.7%
West Bank
No. of students taking a web class
721 666 781 729 775
54 7.5%
46 6.
3%
Students taking only web
206 151 171 161 154
-52 -25.2%
-7 -4.3%
Average no. of web courses taken
1.8
1.7
1.7
1.7 1.7
0 -3.9%
0.
0 0.0%
Students in only F2F classes 1,935 1,911 2,193 2,566 2,513 578 29.9%
-53 -2.1%
Total
2,656 2,577 2,974 3,295 3,288 632 23.8%
-7 -0.2%
Charity School of Nursing
No. of students taking a web class
29 23 22 24 17
-12
-4
1.4% -7
-29.2%
Students taking only web
0
0
0
0 0 N/A N/A N/A N/A
Average no. of web courses taken
1.0
1.0
1.0
1.0 1.0
0 -2.9%
0.
0 0.0%
Students in only F2F classes 759 733 748 808 748
-11 -1.4%
-60 -7.4%
Total
788 756 770 832 765
-23 -2.9%
-67 -8.1%
Northshore site
No of students taking a web class 278 315 516 667 840 562 202.2%
173 25.9%
Students taking only web
16 15 70 89 116 100 625.0%
27 30.3%
Average no. of web courses taken
1.4 1.3 1.6 1.6 1.7
0 15.3%
0 0.
0
Students in only F2F classes 994 1,190 1,361 1,703 1,750 756 76.1%
47 2.8%
Total
1,272 1,505 1,877 2,370 2,590 1,318 103.6%
220 9.3%
Spring Enrollment History 2007-2011 by Online Status
Spring En
rollment History 2007-2011 by Course Location
2/10/2011
13
Office of Institutional Research
Number % Number %
Change Change Change Change
Technical Division 2007 2007 2010 2010
2007 2008 2009 2010 2011
to 2011 to 2011 to 2011 to 2011
No of students taking a web class
19
Students taking only web
1
Average no. of web courses taken
1.6
Students in only F2F classes
1,064
Total
1,083
College Wide
Number
%
Number
%
Change
Change
Change
Change
2007 2007 2010 2010
2007 2008 2009 2010 2011
to 2011 to 2011 to 2011 to 2011
AC / Refrigeration Technician
93 N/A N/A
N/A N/A
Accounting
331 367 408 449
448 117 35.3%
-1 -0.2%
Accounting Technology: Account Clerk
16 N/A N/A
N/A N/A
Administrative Office Technology
78 82 75 87
95
17 21.8%
8 9.2%
American Sign Language
Interpreting
40 29 20 19
38
-2 -5.0%
19 100.0%
American Sign Language Studies
24 24 21 30
24
0 0.0%
-6 -20.0%
Architectural Design Technology * 91 115 103 123
146
55 60.4%
23 18.7%
Associate Arts- LA. Transfer Degree *
75 N/A N/A
N/A N/A
Associate Science- LA. Transfer Degree **
219 N/A N/A
N/A N/A
Automotive Tech
51 N/A N/A
N/A N/A
Barber-Styling
4 N/A N/A
N/A N/A
Building Technology Specialist
1 N/A N/A
N/A N/A
Business Administration
912 1,003
904 967
976
64 7.0%
9
0.9%
Business and Management*
190 224 548 790
971 781 411.1%
181 22.9%
Care & Development of Young Children
398 367 361 421
392 N/A N/A
N/A N/A
Carpentry
11 N/A N/A
N/A N/A
Certified Nurse Assistant -Tech Division
23 N/A N/A
N/A N/A
CET-Construction Management
53 62 71 63
56 N/A N/A
N/A N/A
Civil Construction Technology
30 40 45 37
26
-4 -13.3%
-11 -29.7%
Collision Repair Technology
1 N/A N/A
N/A N/A
Computer Aided Drafting & Design -CADD
101 134 198 203 160
59 58.4%
-43 -21.2%
Computer Information Technology
202 218 227 267
292
90 44.6%
25 9.4%
Computer Network Technology
106 107 132 135
161
55 51.9%
26 19.3%
Computer Repair
23 33 35 47
54
31 134.8%
7 14.9%
Cosmetology
71
N/A N/A
N/A N/A
Cosmetology Teacher Trainer
3
N/A N/A
N/A N/A
Criminal Justice
381 399 448 533
693 312 81.9%
160 30.0%
Culinary Arts
162 174 186 246
301 139 85.8%
55 22.4%
Culinary Arts - Catering
4
20
30
38 N/A N/A
8 26.7%
Culinary Arts - Cook
21 N/A N/A
N/A N/A
Culinary Pastry Assistant-Certificate
5
20
33
65 N/A N/A
32 97.0%
Dental Hygiene
2
N/A N/A
N/A N/A
Dental Laboratory Technology
0
N/A N/A
N/A N/A
Diagnostic Medical Sonography
117 116 144 189
190
73 62.4%
1 0.5%
Diesel Power Technology
8
1
N/A N/A
N/A N/A
Dietetic Technician
32 35 36 56
63 N/A N/A
N/A N/A
Electrical Construction Technician
55 43 55 44
42
-13 -23.6%
-2 -4.5%
Electrical Electronics Engineering
Technology
109 132 139 179
184 N/A N/A
5 2.8%
Electrical Line Helper
1 N/A N/A
N/A N/A
Electrician: Residential
38 N/A N/A
N/A N/A
Emergency Medical Technology
124 129 140 190
187
63 50.8%
-3 -1.6%
English as a Second Language
231 295 421 345
424 193 83.5%
79 22.9%
Entrepreneurship
1
14
22
21 N/A N/A
N/A N/A
Spring Enrollment History 2007-2011 by Online Status
Spring Enrollment History 2007-2011 by Program
2/10/2011
14
Office of Institutional Research
Number % Number %
College Wide
Change Change Change Change
2007 2007 2010 2010
2007 2008 2009 2010 2011
to 2011 to 2011 to 2011 to 2011
Environmental Studies
7 N/A N/A
N/A N/A
EST-Biomedical Equip Repair
Technology
36 25 26 48
47
11 30.6%
-1 -2.1%
EST-Computer Repair Technology
27 31 43 57
52
25 92.6%
-5 -8.8%
EST-Electronics Repair
T
h l
0
0
1
0
N/A N/A
N/A N/A
Fine Arts
111 134 161 195
188
77 69.4%
-7 -3.6%
Fire Protection Technology
93 91 97 69
68
-25 -26.9%
-1 -1.4%
Funeral Service Education
91 78 71 88
96
5 5.5%
8 9.1%
General Science
279 364 465 554
268
-11 -3.9% -286 -51.6%
General Studies
1321 1546 1684 1667
1,850 529 40.0%
183 11.0%
Graphics and Editing Assistant
3 N/A N/A
N/A N/A
Health Information Technology
69 73 69 93
151
82 118.8%
58 62.4%
Homeland
Security
1
0
0
0 0
-1 -100.0%
0
0.0%
Horticulture
37 41 43 42
60
23 62.2%
18 42.9%
Hospitality Management
57 69 79 101 99
42 73.7%
-2 -2.0%
Interior Design
112 117 110 90
108
-4 -3.6%
18 20.0%
Legal Secretary
34 38 52 56
58
24 70.6%
2 3.6%
Logistics Technology
2 N/A N/A
N/A N/A
Machine Tool Technician
13
N/A N/A
N/A N/A
Marine Maintenance Electrical
1
4 N/A N/A
3 300.0%
Massage
Therapy
43
44
47
41 45 2 4.7% 4 9.8%
Medical Coding
89 111 137 224
260 171 192.1%
36 16.1%
Medical Laboratory Technician
92 94 99 151
167
75 81.5%
16 10.6%
Motor Vehicle Technology
169 322 136 202
276 107 63.3%
74 36.6%
Music
74 82 104 135
149
75 101.4%
14 10.4%
No Major Union Program
600 N/A N/A
N/A N/A
Nuclear Medicine Technology
33 25 26 30
36
3 9.1%
6 20.0%
Nursing
740 714 702 753
646
-94
-12.7% -107
-14.2%
Occupational Therapy Assistant
40 48 52 92
135
95 237.5%
43 46.7%
Office Systems Technology: Office
14 N/A N/A
N/A N/A
Ophthalmic Medical Assistant
5
19
11
17
26
21 420.0%
9 52.9%
Painter Apprentice
2 N/A N/A
N/A N/A
Patient Care Technology
28 N/A N/A
N/A N/A
Performance & Media Arts
134 176 190 228
236 102 76.1%
8 3.5%
Pharmacy Technician
128 153 181 231
285 157 122.7%
54 23.4%
Physical Therapist Assisting
226 246 255 370 461 235 104.0%
91 24.6%
Pipefitter Apprentice
3 N/A N/A
N/A N/A
Practical Nursing
146 138 163 216
119
-27 -18.5%
-97 -44.9%
Pre-Nursing
2507 2657 2835 3400
3,338 831 33.1%
-62 -1.8%
Pre-Practical Nursing
220 N/A N/A
N/A N/A
Radiation Therapy-Certificate
23 25 41 53
74
51 221.7%
21 39.6%
Radiologic Technology
793 830 855 1182
1,042 249 31.4%
-140 -11.8%
Real Estate Agent
7
4
0
1
0
-7 -100.0%
-1 -100.0%
Respiratory Care Technology
103 164 162 239
237 134 130.1%
-2 -0.8
%
Safety & Health Technology
25 30 28 31
9
-16 -64.0%
-22 -71.0%
Sheet metal Apprentice
1 N/A N/A
N/A N/A
Surgical Technology
148 182 203 221
278 130 87.8%
57 25.8%
Teaching Grades 1-5
107 207 306
352 N/A N/A
46 15.0%
Veterinary Technology
67 104 121 165
177 110 164.2%
12 7.3%
Visual Communications
121 136 150 149
178
57 47.1%
29 19.5%
Web Site Developer
7
23
31
32
26
19 271.4%
-6 -18.8%
Welder Apprentice
88 N/A N/A
N/A N/A
Workforce
0
0 270 165
0
0 0.0%
-165 -100.0%
Total
11,780 13,179 14,678 17,208 19,258
7,478 63.5% 2,050 11.9%
*Formerly- Louisiana Transfer Degree (AH) ** Louisiana Transfer Degree (SM)
***Formerly - CET - Architechural Technology
Spring Enrollment History 2007-2011 by Program (cont.)
2/10/2011
15
Office of Institutional Research
Number % Number %
College Wide
Change Change Change Change
2007 2007 2010 2010
2007 2008 2009 2010 2011
to 2011 to 2011 to 2011 to 2011
Pre-Nursing
2507 2657 2835 3400
3,338 831 33.1%
-62 -1.8%
General Studies
1321 1546 1684 1667
1,850 529 40.0%
183 11.0%
Radiologic Technology
793 830 855 1182
1,042 249 31.4%
-140 -11.8%
Business Administration
912 1,003
904 967
976
64 7.0%
9 0.9%
Business and Management*
190 224 548 790
971 781 411.1%
181 22.9%
Criminal Justice
381 399 448 533
693 312 81.9%
160 30.0%
Nursing
740 714 702 753
646
-94
-12.7% -107
-14.2%
No Major Union Program
600 N/A N/A
N/A N/A
Physical Therapist Assisting
226 246 255 370 461 235 104.0%
91 24.6%
Accounting
331 367 408 449
448 117 35.3%
-1 -0.2%
English as a Second Language
231 295 421 345
424 193 83.5%
79 22.9%
Care & Development of Young Children
398 367 361 421
392
-6 -1.5%
-29 -6.9%
Teaching Grades 1-5
107 207 306
352 N/A N/A
46 15.0%
Culinary Arts
162 174 186 246
301 139 85.8%
55 22.4%
Computer Information Technology
202 218 227 267
292
90 44.6%
25 9.4%
Pharmacy Technician
128 153 181 231
285 157 122.7%
54 23.4%
Surgical Technology
148 182 203 221
278 130 87.8%
57 25.8%
Motor Vehicle Technology
169 322 136 202
276 107 63.3%
74 36.6%
General Science
279 364 465 554
268
-11 -3.9% -286 -51.6%
Medical Coding
89 111 137 224
260 171 192.1%
36 16.1%
Respiratory Care Technology
103 164 162 239
237 134 130.1%
-2 -0.8%
Performance & Media Arts
134 176 190 228
236 102 76.1%
8 3.5%
Pre-Practical Nursing
220 N/A N/A
N/A N/A
Associate Science- LA. Transfer Degree **
219 N/A N/A
N/A N/A
Diagnostic Medical Sonography
117 116 144 189
190
73 62.4%
1 0.5%
Fine Arts
111 134 161 195
188
77 69.4%
-7 -3.6%
Emergency Medical Technology
124 129 140 190
187
63 50.8%
-3 -1.6%
Electrical Electronics Engineering
109 132 139 179
184
75 68.8%
5 2.8%
Visual Communications
121 136 150 149
178
57 47.1%
29 19.5%
Veterinary Technology
67 104 121 165
177 110 164.2%
12 7.3%
Medical Laboratory Technician
92 94 99 151
167
75 81.5%
16 10.6%
Computer Network Technology
106 107 132 135
161
55 51.9%
26 19.3%
Computer Aided Drafting & Design -CADD
101 134 198 203
160
59 58.4%
-4
3 -21.2%
Health Information Technology
69 73 69 93
151
82 118.8%
58 62.4%
Music
74 82 104 135
149
75 101.4%
14 10.4%
Architectural Design Technology * 91 115 103 123
146
55 60.4%
23 18.7%
Occupational Therapy Assistant
40 48 52 92
135
95 237.5%
43 46.7%
Practical Nursing
146 138 163 216
119
-27 -18.5%
-97 -44.9%
Interior Design
112 117 110 90
108
-4 -3.6%
18 20.0%
Hospitality Management
57 69 79 101 99
42 73.7%
-2 -2.0%
Funeral Service Education
91 78 71 88
96
5 5.5%
8 9.1%
Administrative Office Technology
78 82 75 87
95
17 21.8%
8 9.2%
AC / Refrigeration Technician
93 N/A N/A
N/A N/A
Welder Apprentice
88 N/A N/A
N/A N/A
Associate Arts- LA. Transfer Degree *
75 N/A N/A
N/A N/A
Radiation Therapy-Certificate
23 25 41 53
74
51 221.7%
21 39.6%
Cosmetology
71
N/A N/A
N/A N/A
Fire Protection Technology
93 91 97 69
68
-25 -26.9%
-1 -1.4%
Culinary Pastry Assistant-Certificate
5
20
33
65 N/A N/A
32 97.0%
Dietetic Technician
32 35 36 56
63
31 96.9%
7 12.5%
Horticulture
37 41 43 42
60
23 62.2%
18 42.9%
Legal Secretary
34 38 52 56
58
24 70.6%
2 3.6%
CET-Construction Management
53 62 71 63
56
3 5.7%
-7 -11.1%
Computer Repair
23 33 35 47
54
31 134.8%
7 14.9%
EST-Computer Repair Technology
27 31 43 57
52
25 92.6%
-5 -8.8%
Automotive Tech
51 N/A N/A
N/A N/A
EST-Biomedical Equip Repair
36 25 26 48
47
11 30.6%
-1 -2.1%
Massage
Therapy
43
44
47
41
45
2 4.7%
4 9.8%
Electrical Construction Technician
55 43 55 44
42
-13 -23.6%
-2 -4.5%
Spring Enrollment History 2007-2011 by Program
Ranked by Student Total
2/10/2011
16
Office of Institutional Research
Number % Number %
College Wide
Change Change Change Change
2007 2007 2010 2010
2007 2008 2009 2010 2011
to 2011 to 2011 to 2011 to 2011
A
merican Sign Language
40 29 20 19
38
-2 -5.0%
19 100.0%
Culinary Arts - Catering
4
20
30
38 N/A N/A
8 26.7%
Electrician: Residential
38 N/A N/A
N/A N/A
Nuclear Medicine Technology
33 25 26 30
36
3 9.1%
6 20.0%
Patient Care Technology
28 N/A N/A
N/A N/A
Civil Construction Technology
30 40 45 37
26
-4 -13.3%
-11 -29.7%
Ophthalmic Medical Assistant
5
19
11
17
26 21 420.0% 9 52.9%
Web Site Developer
7
23
31
32
26
19 271.4%
-6 -18.8%
American Sign Language Studies
24 24 21 30
24
0 0.0%
-6 -20.0%
Certified Nurse Assistant -Tech Division
23 N/A N/A
N/A N/A
Culinary Arts - Cook
21 N/A N/A
N/A N/A
Entrepreneurship
1
14
22
21 N/A N/A
-1 -4.5%
Accounting Technology: Account Clerk
16 N/A N/A
N/A N/A
Office Systems Technology: Office
14 N/A N/A
N/A N/A
Machine Tool Technician
13
N/A N/A
N/A N/A
Carpentry
11 N/A N/A
N/A N/A
Safety & Health Technology
25 30 28 31
9
-16 -64.0%
-22 -71.0%
Environmental Studies
7 N/A N/A
N/A N/A
Barber-Styling
4 N/A N/A
N/A N/A
Marine Maintenance Electrical
Apprentice
1
4 N/A N/A N/A N/A
Cosmetology Teacher Trainer 3 N/A N/A N/A N/A
Graphics and Editing Assistant 3 N/A N/A N/A N/A
Pipefitter Apprentice 3 N/A N/A N/A N/A
Logistics Technology 2 N/A N/A N/A N/A
Painter Apprentice 2 N/A N/A N/A N/A
Building Technology Specialist 1 N/A N/A N/A N/A
Collision Repair Technology
1 N/A N/A
N/A N/A
Diesel Power Technology
8
1
N/A N/A
-7 -87.5%
Electrical Line Helper
1 N/A N/A
N/A N/A
Sheet metal Apprentice
1 N/A N/A
N/A N/A
Homeland
Security
1
0
0
0 0 N/A N/A N/A N/A
Real Estate Agent
7
4
0
1
0 N/A N/A
N/A N/A
Workforce
0
0 270 165
0
0 0.0%
-165 -100.0%
Dental Hygiene
2
N/A N/A
N/A N/A
Dental Laboratory Technology
0
N/A N/A
N/A N/A
EST-Electronics Repair
0
0
1
0
N/A N/A
N/A N/A
Total
11,780 13,179 14,678 17,208 19,258 7,478 63.5% 2,050 11.9%
Number % Number %
College Wide
Change Change Change Change
2007 2007 2010 2010
2007 2008 2009 2010 2011
to 2011 to 2011 to 2011 to 2011
Orleans
3,078
3,448
3,976
4,788
5,596 2,518 81.8%
808 16.9%
Jefferson
4,820
5,271
5,860
6,277
6,794 1,974 41.0%
517 8.2%
St. Tammany
1,655
1,973
2,179
2,730
2,896 1,241 75.0%
166 6.1%
St. Charles
413
431 470 526
593 180 43.6%
67 12.7%
St. Bernard
197
192 214 236
282
85 43.1%
46 19.5%
St. John
274
287 278 335
365
91 33.2%
30 9.0%
Plaquemines
219
193 203 244
218
-1 -0.5%
-26 -10.7%
Terrebonne
103
112 89 68
75
-28 -27.2%
7
10.3%
Lafourche
116
112 99 94
81
-35 -30.2%
-13 -13.8%
St. James
44
42 39 32
44
0 0.0%
12 37.5%
Other
861
1,118
1,271
1,878
2,314 1,453 168.8%
436 23.2%
Total
11,780 13,179 14,678 17,208 19,258 7,478 63.5% 2,050 11.9%
Spring Enrollment History 2007-2011 by Parish
Spring Enrollment History 2007-2011 by Program
Ranked by Student Total, continued
2/10/2011
17
Office of Institutional Research
Number % Number %
City Park
Change Change Change Change
2007 2007 2010 2010
2007 2008 2009 2010 2011
to 2011 to 2011 to 2011 to 2011
Orleans
2,254
2,701
3,119
3,773
4,193 1,939 86.0%
420 11.1%
Jefferson
2,831
3,286
3,629
3,885
3,968 1,137 40.2%
83 2.1%
St. Tammany
495
650 574 762
749 254 51.3%
-13 -1.7%
St. Charles
335
347 386 435
500 165 49.3%
65 14.9%
St. Bernard
129
140 158 170
167
38 29.5%
-3 -1.8%
St. John
249
259 239 304
327
78 31.3%
23 7.6%
Plaquemines
68
44 43 65
64
-4 -5.9%
-1 -1.5%
Terrebonne
80
92 70 54
62
-18 -22.5%
8
14.8%
Lafourche
95
89 69 75
69
-26 -27.4%
-6 -8.0%
St. James
37
37 24 28
35
-2 -5.4%
7
25.0%
Other
491
696 746 1,160
1,398 907 184.7% 238 20.5%
Total
7,064 8,341 9,057 10,711 11,532 4,468 63.3% 821 7.7%
West Bank
Orleans
625
574 676 816
901 276 44.2% 85 10.4%
Jefferson
1,671
1,622
1,839
1,994
1,983 312 18.7%
-11 -0.6%
St. Tammany
38
34 34 43
42
4 10.5%
-1 -2.3%
St. Charles
39
43 52 61
40
1 2.6%
-21 -34.4%
St. Bernard
14
8 14 17
15
1 7.1%
-2 -11.8%
St. John
12
8 24 17
13
1 8.3%
-4 -23.5%
Plaquemines
132
138 147 159
138
6 0.0%
-21 -13.2%
Terrebonne
12
10 12 8
6
-6 -50.0%
-2 -25.0%
Lafourche
13
17 14 9
3
-10
-76.9% -6
-66.7%
St. James
2
1 12 3
2
0 0.0%
-1 -33.3%
Other
98
122 150 168
145
47 48.0%
-23 -13.7%
Total
2,656 2,577 2,974 3,295 3,288 632 23.8%
-7 -0.2%
Spring Enrollment History 2007-2011 by Parish
-
1,000
2,000
3,000
4,000
5,000
6,000
7,000
8,000
College Wide Enrollment by Parish
2007
2008
2009
2010
2011
2/10/2011
18
Office of Institutional Research
Charity School of Nursing
Orleans
184 158 150 157
148
-36 -19.6%
-9 -5.7%
Jefferson
302 340 345 341
334
32 10.6%
-7 -2.1%
St. Tammany
130 111 126 150
124
-6 -4.6%
-26 -17.3%
St. Charles
37 40 29 27
23
-14
-37.8% -4
-14.8%
St. Bernard
48 36 28 40
32
-16
-33.3% -8
-20.0%
St. John
12 14 12 14
11
-1 -8.3%
-3 -21.4%
Plaquemines
19 9
12
17
8
-11
-57.9% -9
-52.9%
Terrebonne
10
9
5
5
4
-6 -60.0%
-1 -20.0%
Lafourche
8
6 16
9
7
-1 -12.5%
-2 -22.2%
St. James
5
4
2
1
2
-3 -60.0%
1 100.0%
Other
33 29 45 71
72
39 118.2%
1 1.4%
Total
788 756 770 832 765
-23 -2.9%
-67 -8.1%
Slidell/Northshore
Orleans
15 15 31 42
38
23 153.3%
-4 -9.5%
Jefferson
16 23 47 57
46
23 187.5%
-11 -19.3%
St. Tammany
992 1178 1445 1775
1,845 667 N/A
70 0.0%
St. Charles
2
1
3
3
4
3 100.0%
1 33.3%
St. Bernard
6
8 14
9
14
6 133.3%
5 55.6%
St. John
1
3
3
0
4
1 300.0%
4 0.0%
Plaquemines
0
2
1
3
2
0 N/A
-1 0.0%
Tangipahoa
115 143 164 261
340 197 195.7%
79 0.0%
Terrebonne
1
1
2
1
0
-1 -100.0%
-1 -100.0%
Lafourche
0
0
0
1
0
0 0.0%
-1 -100.0%
St. James
0
0
1
0
1
1 0.0%
1 0.0%
Washington
81 82 100 118
152
70 87.7%
34 28.8%
Other
43 49 66 100
144
95 234.9%
44 44.0%
Total
1,272 1,505 1,877 2,370 2,590 1,085 103.6%
220 9.3%
Technical Division
Orleans
316
Jefferson
463
Lafourche
2
Plaquemines
6
St. Bernard
54
St. Charles
26
St. James
4
St. John
10
St. Tammany
136
Terrebonne
3
Other
63
Total
1,083
Spring Enrollment History 2007-2011 by Parish
2/10/2011
19
Office of Institutional Research
Number % Number %
College Wide
Change Change Change Change
Zip
2007 2007 2010 2010
Code 2007 2008 2009 2010 2011
to 2011 to 2011 to 2011 to 2011
Metairie S of I-10 70001
472 525 525 590 670
198 41.9%
80 13.6%
Metairie 70002
205 243 243 265 318
113 55.1%
53 20.0%
West Metairie 70003
506 583 583 607 643
137 27.1%
36 5.9%
Old Metairie-Bucktown 70005
229 265 265 303 314
85 37.1%
11 3.6%
Metairie Clearview N of I-10 70006
174 203 203 209 233
59 33.9%
24 11.5%
Belle Chasse 70037
164 172 172 213 183
19 11.6%
-30 -14.1%
Chalmette 70043
65 83 83 98 145
80 123.1%
47 48.0%
Destrehan
70047
124 139 139 136 174
50 40.3%
38 27.9%
Gretna 70053
177 176 176 214 221
44 24.9%
7 3.3%
Gretna/S of Whitney 70056
565 640 640 720 778
213 37.7%
58 8.1%
Harvey 70058
658 670 670 769 902
244 37.1%
133 17.3%
South Kenner 70062
219 217 217 230 270
51 23.3%
40 17.4%
North Kenner 70065
700 807 807 835 867
167 23.9%
32 3.8%
LaPlace 70068
282 266 266 322 350
68 24.1%
28 8.7%
Marrero 70072
814 879 879 1043 1144
330 40.5%
101 9.7%
Westwego 70094
431 498 498 542 560
129 29.9%
18 3.3%
Algiers 70114
327 319 319 408 464
137 41.9%
56 13.7%
Uptown 70115
222 262 262 295 358
136 61.3%
63 21.4%
French Quarter-Marigny 70116
94 103 103 133 129
35 37.2%
-4 -3.0%
Bywater/ Lower 9th Ward 70117
180 235 235 287 369
189 105.0%
82 28.6%
Carrollton/Riverbend 70118
255 261 261 309 344
89 34.9%
35 11.3%
Mid City 70119
295 393 393 505 629
334 113.2%
124 24.6%
N.O. Postal Box Zone 70121
133 143 143 171 192
59 44.4%
21 12.3%
Lakefront/Gentilly 70122
258 335 335 465 613
355 137.6%
148 31.8%
Harahan-Jefferson 70123
277 292 292 332 315
38 13.7%
-17 -5.1%
Lakefront/Lakeview 70124
104 168 168 204 222
118 113.5%
18 8.8%
Broadmoor 70125
115 136 136 173 197
82 71.3%
24 13.9%
N.O. East Crowder 70126
155 270 270 386 493
338 218.1%
107 27.7%
N.O. East Crowder to Wright Rd 70127
198 245 245 337 449
251 126.8%
112 33.2%
N.O. East Wright Rd to I-510 70128
195 257 257 297 356
161 82.6%
59 19.9%
N.O. East Past I-510 70129
157 173 173 189 174
17 10.8%
-15 -7.9%
N.O. CBD Lower Garden District 70130
92 104 104 122 142
50 54.3%
20 16.4%
Lower Coast Algiers 70131
386 424 424 487 502
116 30.1%
15 3.1%
Covington
70433
178 226 248 295 327
149 83.7%
32 10.8%
Covington
70435
80 127 128 152 160
80 100.0%
8 5.3%
Slidell
70458
384 410 410 530 592
208 54.2%
62 11.7%
Slidell
70460
283 302 302 353 382
99 35.0%
29 8.2%
Slidell
70461
341 361 361 463 436
95 27.9%
-27 -5.8%
Subtotal
10,494 11,912 11,935 13,989 15,617 5,123 48.8% 1,628 11.6%
Other Louisiana
2,856 3,027 3,027 3,130 3,525 669 23.4%
395 12.6%
Total Louisiana
13,350 14,939 14,962 17,119 19,142 5,792 43.4% 2,023 11.8%
Out-of-State/Unknown
87 92 92 89 116
29 33.3%
27 30.3%
Total
13,437 15,031 15,054 17,208 19,258 5,792 43.4% 2,023 11.8%
Spring Enrollment History 2007-2011 by Zip Code (zip code order)
2/10/2011
20
Office of Institutional Research
Number % Number %
City Park
Change Change Change Change
Zip
2007 2007 2010 2010
Code 2007 2008 2009 2010 2011
to 2011 to 2011 to 2011 to 2011
Metairie S of I-10 70001
410 416 463 522 557
147 35.9%
35 6.7%
Metairie 70002
154 188 223 240 276
122 79.2%
36 15.0%
West Metairie 70003
395 462 530 563 552
157 39.7%
-11 -2.0%
Old Metairie-Bucktown 70005
182 205 231 270 267
85 46.7%
-3 -1.1%
Metairie Clearview N of I-10 70006
132 156 182 194 198
66 50.0%
4 2.1%
Belle Chasse 70037
45 38 37 54 55
10 22.2%
1 1.9%
Chalmette 70043
34 52 61 78 96
62 182.4%
18 23.1%
Destrehan
70047
110 108 118 119 150
40 36.4%
31 26.1%
Gretna 70053
53 74 69 73 76
23 43.4%
3 4.1%
Gretna/S of Whitney 70056
181 214 237 276 279
98 54.1%
3 1.1%
Harvey 70058
183 255 230 256 317
134 73.2%
61 23.8%
South Kenner 70062
170 198 192 210 237
67 39.4%
27 12.9%
North Kenner 70065
584 637 726 748 753
169 28.9%
5 0.7%
LaPlace 70068
226 254 229 291 310
84 37.2%
19 6.5%
Marrero 70072
193 247 268 339 353
160 82.9%
14 4.1%
Westwego 70094
135 187 171 237 215
80 59.3%
-22 -9.3%
Algiers 70114
110 110 100 114 105
-5 -4.5%
-9 -7.9%
Uptown 70115
197 194 224 264 300
103 52.3%
36 13.6%
French Quarter-Marigny 70116
87 87 91 120 114
27 31.0%
-6 -5.0%
Bywater/ Lower 9th Ward 70117
127 162 217 262 304
177 139.4%
42 16.0%
Carrollton/Riverbend 70118
173 235 237 279 299
126 72.8%
20 7.2%
Mid City 70119
202 275 359 460 552
350 173.3%
92 20.0%
N.O. Postal Box Zone 70121
117 121 130 158 173
56 47.9%
15 9.5%
Lakefront/Gentilly 70122
154 240 308 436 544
390 253.2%
108 24.8%
Harahan-Jefferson 70123
210 236 249 298 271
61 29.0%
-27 -9.1%
Lakefront/Lakeview 70124
53 91 155 187 187
134 252.8%
0 0.0%
Broadmoor 70125
70 108 123 158 176
106 151.4%
18 11.4%
N.O. East Crowder 70126
72 140 248 356 431
359 498.6%
75 21.1%
N.O. East Crowder to Wright Rd 70127
104 180 220 301 394
290 278.8%
93 30.9%
N.O. East Wright Rd to I-510 70128
95 184 237 274 316
221 232.6%
42 15.3%
N.O. East Past I-510 70129
92 144 152 162 149
57 62.0%
-13 -8.0%
N.O. CBD Lower Garden District 70130
87 80 167 104 113
26 29.9%
9 8.7%
Lower Coast Algiers 70131
106 124 167 194 186
80 75.5%
-8 -4.1%
Covington
70433
50 79 64 80 79
29 58.0%
-1 -1.3%
Covington
70435
27 39 32 34 27
0 0.0%
-7 -20.6%
Slidell
70458
110 145 109 153 156
46 41.8%
3 2.0%
Slidell
70460
66 85 72 117 108
42 63.6%
-9 -7.7%
Slidell
70461
103 122 118 138 134
31 30.1%
-4 -2.9%
Subtotal
5,599 6,872 7,746 9,119 9,809 4,210 75.2%
690 7.6%
Other Louisiana
1,424 1,522 1,346 1,527 1,651 227 15.9%
124 8.1%
Total Louisiana
7,023 8,394 9,092 10,646 11,460 4,437 63.2%
814 7.6%
Out-of-State/Unknown
118 65 61 65 72
-46 -39.0%
7 10.8%
Total
7,141 8,459 9,153 10,711 11,532 4,437 63.2%
814 7.6%
2/10/2011
21
Office of Institutional Research
Number % Number %
West Bank
Change Change Change Change
Zip
2007 2007 2010 2010
Code 2007 2008 2009 2010 2011
to 2011 to 2011 to 2011 to 2011
Metairie S of I-10 70001
19 17 27 22 12
-7 -36.8%
-10 -45.5%
Metairie 70002
8 11
11
18 8
0 0.0%
-10 -55.6%
West Metairie 70003
23 13 14 18 17
-6 -26.1%
-1 -5.6%
Old Metairie-Bucktown 70005
15 6 12 6 5
-10 -66.7%
-1 -16.7%
Metairie Clearview N of I-10 70006
5
5
7
2
8
3 60.0%
6 300.0%
Belle Chasse 70037
114 116 121 140 107
-7 -6.1%
-33 -23.6%
Chalmette 70043
2
3
6
5
5
3 0.0%
0 0.0%
Destrehan
70047
8
7
8
6
4
-4 -50.0%
-2 -33.3%
Gretna 70053
122 96 100 132 127
5 4.1%
-5 -3.8%
Gretna/S of Whitney 70056
319 318 370 411 428
109 34.2%
17 4.1%
Harvey 70058
357 365 407 488 507
150 42.0%
19 3.9%
South Kenner 70062
12 6 13 10 3
-9 -75.0%
-7 -70.0%
North Kenner 70065
15 19 36 35 19
4 26.7%
-16 -45.7%
Jean Lafitte
70067
20 25 23 24 24
4 20.0%
0 0.0%
LaPlace 70068
7 4 18 15 9
2 28.6%
-6 -40.0%
Marrero 70072
524 512 554 634 669
145 27.7%
35 5.5%
Plaquemines
70083
14 28 27 21 17
3 21.4%
-4 -19.0%
Westwego 70094
230 218 298 274 268
38 16.5%
-6 -2.2%
Algiers 70114
212 207 206 274 331
119 56.1%
57 20.8%
Uptown 70115
15 20 25 17 29
14 93.3%
12 70.6%
French Quarter-Marigny 70116
6
3
7 10 5
-1 -16.7%
-5 -50.0%
Bywater/ Lower 9th Ward 70117
12 11 12 16 26
14 116.7%
10 62.5%
Carrollton/Riverbend 70118
6 11
17
17
12
6 100.0%
-5 -29.4%
Mid City 70119
11 10 17 24 29
18 163.6%
5 20.8%
N.O. Postal Box Zone 70121
10 5
7
3
3
-7 -70.0%
0 0.0%
Lakefront/Gentilly 70122
6 7 13 16 23
17 283.3%
7 43.8%
Harahan-Jefferson 70123
11 16 17 15 12
1 9.1%
-3 -20.0%
Lakefront/Lakeview 70124
3
4
3
3
7
4 133.3%
4 133.3%
Broadmoor 70125
6
3
6
9
9
3 50.0%
0 0.0%
N.O. East Crowder 70126
7 9 16 19 15
8 114.3%
-4 -21.1%
N.O. East Crowder to Wright Rd 70127
13 9 18
23
19
6 46.2%
-4 -17.4%
N.O. East Wright Rd to I-510 70128
2 3 10 14 14
12 600.0%
0 0.0%
N.O. East Past I-510 70129
6 10
10
14
12
6 100.0%
-2 -14.3%
N.O. CBD Lower Garden District 70130
11 6 13
15
18
7 63.6%
3 20.0%
Lower Coast Algiers 70131
255 244 236 278 273
18 7.1%
-5 -1.8%
Covington
70433
2
2
4
3
5
3 150.0%
2 66.7%
Covington
70435
1
1
0
1
1
0 0.0%
0 0.0%
Slidell
70458
8
5
7
9
6
-2 -25.0%
-3 -33.3%
Slidell
70460
4
4
4
6
4
0 0.0%
-2 -33.3%
Slidell
70461
7
6
6
7
5
-2 -28.6%
-2 -28.6%
Subtotal
2,428 2,365 2,706 3,054 3,095 667 27.5%
41 1.3%
Other Louisiana
205 203 252 233 178
-27 -13.2%
-55 -23.6%
Total Louisiana
2,633 2,568 2,958 3,287 3,273 640 24.3%
-14 -0.4%
Out-of-State/Unknown
26 12 20 8 15
-11 -42.3%
7 87.5%
Total
2,659 2,580 2,978 3,295 3,288 640 24.3%
-14 -0.4%
2/10/2011
22
Office of Institutional Research
Number % Number %
Charity School of Nursing
Change Change Change Change
Zip
2007 2007 2010 2010
Code 2007 2008 2009 2010 2011
to 2011 to 2011 to 2011 to 2011
Metairie S of I-10 70001
35 35 28 2 44
9 25.7%
42 2100.0%
Metairie 70002
5
5
8
6 10
5 100.0%
4 66.7%
West Metairie 70003
24 30 36 25 35
11 45.8%
10 40.0%
Old Metairie-Bucktown 70005
16 17 20 25 19
3 18.8%
-6 -24.0%
Metairie Clearview N of I-10 70006
7 13
13
10
10
3 42.9%
0 0.0%
Belle Chasse 70037
12 10 12 18 12
0 0.0%
-6 -33.3%
Chalmette 70043
13 9 11
13
14
1 7.7%
1 7.7%
Destrehan
70047
10 9 13 10 8
-2 -20.0%
-2 -20.0%
Gretna 70053
6
7
7
9
7
1 16.7%
-2 -22.2%
Gretna/S of Whitney 70056
28 33 32 29 33
5 17.9%
4 13.8%
Harvey 70058
35 37 29 20 18
-17 -48.6%
-2 -10.0%
South Kenner 70062
8
15 11 9 6
-2 -25.0%
-3 -33.3%
North Kenner 70065
47 43 44 50 49
2 4.3%
-1 -2.0%
LaPlace 70068
18 22 17 16 13
-5 -27.8%
-3 -18.8%
Marrero 70072
48 54 52 67 47
-1 -2.1%
-20 -29.9%
Westwego 70094
25 26 29 30 28
3 12.0%
-2 -6.7%
Algiers 70114
10 10 13 19 14
4 40.0%
-5 -26.3%
Uptown 70115
6 8 10 12 10
4 66.7%
-2 -16.7%
French Quarter-Marigny 70116
7
4
4
2
5
-2 -28.6%
3 150.0%
Bywater/ Lower 9th Ward 70117
4
6
5
7
9
5 125.0%
2 28.6%
Carrollton/Riverbend 70118
6
8
6 12 8
2 33.3%
-4 -33.3%
Mid City 70119
15 10 17 18 15
0 0.0%
-3 -16.7%
N.O. Postal Box Zone 70121
9
7
6 10 7
-2 -22.2%
-3 -30.0%
Lakefront/Gentilly 70122
9 10
12
12
12
3 33.3%
0 0.0%
Harahan-Jefferson 70123
26 25 24 16 18
-8 -30.8%
2 12.5%
Lakefront/Lakeview 70124
4 9 10 12 16
12 300.0%
4 33.3%
Broadmoor 70125
5
4
5
4
3
-2 -40.0%
-1 -25.0%
N.O. East Crowder 70126
7
5
3
7 11
4 57.1%
4 57.1%
N.O. East Crowder to Wright Rd 70127
9
8
7
8
6
-3 -33.3%
-2 -25.0%
N.O. East Wright Rd to I-510 70128
8
7
7
7
5
-3 -37.5%
-2 -28.6%
N.O. East Past I-510 70129
3
2
9
9
3
0 0.0%
-6 -66.7%
N.O. CBD Lower Garden District 70130
1
4
6
3
5
4 400.0%
2 66.7%
Lower Coast Algiers 70131
22 18 21 15 18
-4 -18.2%
3 20.0%
Covington
70433
20 13 12 9 10
-10 -50.0%
1 11.1%
Covington
70435
5
6
7
8 13
8 160.0%
5 62.5%
Slidell
70458
27 22 31 43 3
-24 -88.9%
-40 -93.0%
Slidell
70460
21 27 20 21 14
-7 -33.3%
-7 -33.3%
Slidell
70461
25 15 22 24 16
-9 -36.0%
-8 -33.3%
Subtotal
586 593 619 617 574
-12 -2.0%
-43 -7.0%
Other Louisiana
179 207 179 213 190
11 6.1%
-23 -10.8%
Total Louisiana
765 800 798 830 764
-1 -0.1%
-66 -8.0%
Out-of-State/Unknown
22 20 3 2 1
-21 -95.5%
-1 -50.0%
Total
787 820 801 832 765
-1 -0.1%
-66 -8.0%
2/10/2011
23
Office of Institutional Research
Number % Number %
Slidell/Northshore
Change Change Change Change
Zip
2007 2007 2010 2010
Code 2007 2008 2009 2010 2011
to 2011 to 2011 to 2011 to 2011
Metairie S of I-10 70001
2
4
7
7
2
0 0.0%
-5 -71.4%
Metairie 70002
0
1
1
1
2
2 0.0%
1 100.0%
West Metairie 70003
1
1
3
1
2
1 100.0%
1 100.0%
Old Metairie-Bucktown 70005
0
1
2
2
3
3 0.0%
1 50.0%
Metairie Clearview N of I-10 70006
1
0
1
3
2
1 100.0%
-1 -33.3%
Belle Chasse 70037
0
0
2
1
2
2 0.0%
1 0.0%
Chalmette 70043
0
1
5
2
6
6 0.0%
4 0.0%
Destrehan
70047
0
0
0
1
1
1 0.0%
0 0.0%
Gretna 70053
1
0
0
0
1
0 0.0%
1 0.0%
Gretna/S of Whitney 70056
1
0
1
4
0
-1 -100.0%
-4 -100.0%
Harvey 70058
0
1
4
5
5
5 0.0%
0 0.0%
South Kenner 70062
0
0
1
1
0
0 0.0%
-1 -100.0%
North Kenner 70065
0
1
1
2
0
0 0.0%
-2 -100.0%
LaPlace 70068
1
2
2
0
3
2 200.0%
3 0.0%
Marrero 70072
1
1
5
3
4
3 300.0%
1 33.3%
Westwego 70094
0
0
0
1
1
1 0.0%
0 0.0%
Algiers 70114
0
0
0
1
2
2 0.0%
1 0.0%
Uptown 70115
2
0
3
2
1
-1 0.0%
-1 -50.0%
French Quarter-Marigny 70116
0
0
1
1
0 0
0.0%
-1 -100.0%
Bywater/ Lower 9th Ward 70117
0
1
1
2
1
1 0.0%
-1 -50.0%
Carrollton/Riverbend 70118
0
1
1
1
4
4 0.0%
3 300.0%
Mid City 70119
0
0
0
3
2
2 0.0%
-1 -33.3%
N.O. Postal Box Zone 70121
0
0
0
0
0
0 0.0%
0 0.0%
Lakefront/Gentilly 70122
0
1
2
1
1
1 0.0%
0 0.0%
Harahan-Jefferson 70123
0
0
2
3
1
1 0.0%
-2 -66.7%
Lakefront/Lakeview 70124
0
0
0
2
2
2 0.0%
0 0.0%
Broadmoor 70125
0
0
2
2
1 1
0.0%
-1 -50.0%
N.O. East Crowder 70126
0
1
3
4
3
3 0.0%
-1 -25.0%
N.O. East Crowder to Wright Rd 70127
0
1
0
5
1
1 0.0%
-4 -80.0%
N.O. East Wright Rd to I-510 70128
1
1
3
2
2
1 0.0%
0 0.0%
N.O. East Past I-510 70129
3
1
2
4
5
2 66.7%
1 25.0%
N.O. CBD Lower Garden District 70130
1
2
1
0
0
-1 -100.0%
0 0.0%
Lower Coast Algiers 70131
0
0
0
0
2
2 0.0%
2 0.0%
St. Tammany
70420
32 45 57 55 63
31 96.9%
8 14.5%
Washington
70427
35 33 44 48 67
32 91.4%
19 39.6%
Covington
70433
106 132 168 203 225
119 112.3%
22 10.8%
Covington
70435
47 81 89 109 113
66 140.4%
4 3.7%
St. Tammany
70445
55 64 75 100 95
40 72.7%
-5 -5.0%
St. Tammany
70448
70 88 109 127 136
66 94.3%
9 7.1%
St. Tammany
70452
59 87 75 103 114
55 93.2%
11 10.7%
Slidell
70458
192 212 263 325 366
174 90.6%
41 12.6%
Slidell
70460
134 167 206 209 231
97 72.4%
22 10.5%
Slidell
70461
171 198 215 294 266
95 55.6%
-28 -9.5%
St. Tammany
70471
70 60 90 122 124
54 77.1%
2 1.6%
Subtotal
986 1,189 1,447 1,762 1,862 876 88.8%
100 5.7%
Other Louisiana
248 241 269 594 712 464 187.1%
118 19.9%
Total Louisiana
1,234 1,430 1,716 2,356 2,574 1,340 108.6%
218 9.3%
Out-of-State/Unknown
6 16 17 14 16
10 166.7%
2 14.3%
Total
1,240 1,446 1,733 2,370 2,590 1,350 108.9%
220 9.3%
2/10/2011
24
Office of Institutional Research
Number % Number %
Technical Division
Change Change Change Change
Zip
2007 2007 2010 2010
Code 2007 2008 2009 2010 2011
to 2011 to 2011 to 2011 to 2011
Metairie S of I-10 70001
55
N/A N/A
N/A N/A
Metairie 70002
22
N/A N/A
N/A N/A
West Metairie 70003
37
N/A N/A
N/A N/A
Old Metairie-Bucktown 70005
20
N/A N/A
N/A N/A
Metairie Clearview N of I-10 70006
15
N/A N/A
N/A N/A
Belle Chasse 70037
7
N/A N/A
N/A N/A
Chalmette 70043
24
N/A N/A
N/A N/A
Destrehan
70047
11
N/A N/A
N/A N/A
Gretna 70053
10
N/A N/A
N/A N/A
Gretna/S of Whitney 70056
38
N/A N/A
N/A N/A
Harvey 70058
55
N/A N/A
N/A N/A
South Kenner 70062
24
N/A N/A
N/A N/A
North Kenner 70065
46
N/A N/A
N/A N/A
LaPlace 70068
15
N/A N/A
N/A N/A
Marrero 70072
71
N/A N/A
N/A N/A
Westwego 70094
48
N/A N/A
N/A N/A
Algiers 70114
12
N/A N/A
N/A N/A
Uptown 70115
18
N/A N/A
N/A N/A
French Quarter-Marigny 70116
5 N/A N/A
N/A N/A
Bywater/ Lower 9th Ward 70117
29
N/A N/A
N/A N/A
Carrollton/Riverbend 70118
21
N/A N/A
N/A N/A
Mid City 70119
31
N/A N/A
N/A N/A
N.O. Postal Box Zone 70121
9
N/A N/A
N/A N/A
Lakefront/Gentilly 70122
33
N/A N/A
N/A N/A
Harahan-Jefferson 70123
13
N/A N/A
N/A N/A
Lakefront/Lakeview 70124
10
N/A N/A
N/A N/A
Broadmoor 70125
8 N/A N/A
N/A N/A
N.O. East Crowder 70126
33
N/A N/A
N/A N/A
N.O. East Crowder to Wright Rd 70127
29
N/A N/A
N/A N/A
N.O. East Wright Rd to I-510 70128
19
N/A N/A
N/A N/A
N.O. East Past I-510 70129
5
N/A N/A
N/A N/A
N.O. CBD Lower Garden District 70130
6
N/A N/A
N/A N/A
Lower Coast Algiers 70131
23
N/A N/A
N/A N/A
St. Tammany
70420
0
N/A N/A
N/A N/A
Washington
70427
1
N/A N/A
N/A N/A
Covington
70433
8
N/A N/A
N/A N/A
Covington
70435
6
N/A N/A
N/A N/A
St. Tammany
70445
5
N/A N/A
N/A N/A
St. Tammany
70448
4
N/A N/A
N/A N/A
St. Tammany
70452
16
N/A N/A
N/A N/A
Slidell
70458
38
N/A N/A
N/A N/A
Slidell
70460
25
N/A N/A
N/A N/A
Slidell
70461
15
N/A N/A
N/A N/A
St. Tammany
70471
6
N/A N/A
N/A N/A
Subtotal
926 N/A N/A
N/A N/A
Other Louisiana
145 N/A N/A
N/A N/A
Total Louisiana
1,071 N/A N/A
N/A N/A
Out-of-State/Unknown
12 N/A N/A
N/A N/A
Total
1,083
2/10/2011
25
Office of Institutional Research