7th Day
Enrollment Report
Summ
er 2010
Published on June 18, 2010
By The Office of Institutional Research
Table of Contents
page no.
Student Demographics 1
Gender
Ethnicity
Citizenship
General Statistics 2
Full-time/Part-time Status
Degree Seeking
Enrollment by Age 3
Enrollment by Campus 4
Enrollment by Parish 4
Enrollment by Division 5
Enrollment by Admission Status 6
Enrollment by Classification 6
Top Ten Most Popular Majors 7
Enrollment by Online Status 8
Enrollment by Program - ranked by enrollment 9
Two Year Comparison of Program Enrollment by Campus 11
Top 50 "Feeder" High Schools of First Time Freshmen 15
Enrollment by Zip Code 16
Student Demographics
0
2,000
4,000
6,000
8,000
Women Men
Enrollment by Gender
Summer 2010
Summer 2009
1,000
1,500
2,000
2,500
3,000
3,500
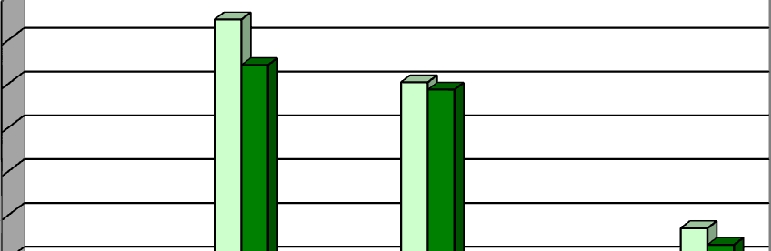
Enrollment by Ethnicity
Summer 2010 Summer 2009 Inc/Dec % Change
Number Percent Number Percent Number Percent
Women
5,364
72%
4,641
62% 723
15.6%
Men
2,085
28%
1,902
26% 183
9.6%
254
3%
230
3% 24
10.4%
American Indian
30
0%
36
0%
-6
-16.7%
Black, Non-Hispanic 3,233
43%
2,713
36% 520
19.2%
Hispanic
392
5%
362
5% 30
8.3%
White, Non-Hispanic 2,516
34%
2,432
33% 84
3.5%
Non Resident Alien
85
1%
64
1% 21
32.8%
Two or more Races
89
1%
46
1% 43
93.5%
Did Not Indicate
850
11%
660
9% 190
28.8%
Total
7,449 100% 6,543 88%
906
13.8%
Asian/Pacific Islander
0
2,000
4,000
6,000
8,000
Women Men
Enrollment by Gender
Summer 2010
Summer 2009
0
500
1,000
1,500
2,000
2,500
3,000
3,500
Enrollment by Ethnicity
Summer 2010
Summer 2009
6/18/2010
1
Office of Institutional Research
General Statistics
0
1,000
2,000
3,000
4,000
5,000
Full-time Students
Part-time Students
Full-Time/Part-Time Enrollment
Summer 2010
Summer 2009
40 000
42,000
Degree-Seeking and Non-Degree-Seeking Students
Summer 2010 Summer 2009 Inc/Dec % Change
Number Percent Number Percent Number Percent
Full-time Students
4,879 65% 3,958 53% 921 23.3%
Part-time Students
2,570 35% 2,585 35%
-15 -0.6%
SCH
40,807
34,736
6,071 17.5%
FTE Other (based on 6 SCH)
6,801
5,789
1,012 17.5%
Total Credit Enrollment 7,449 100% 6,543 88% 906 13.8%
0
1,000
2,000
3,000
4,000
5,000
Full-time Students
Part-time Students
Full-Time/Part-Time Enrollment
Summer 2010
Summer 2009
30,000
32,000
34,000
36,000
38,000
40,000
42,000
SCH
Degree-Seeking and Non-Degree-Seeking Students
Summer 2010
Summer 2009
6/18/2010
2
Office of Institutional Research
S
S
/
%C
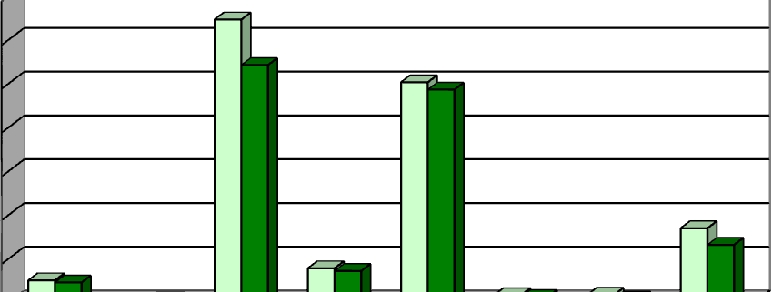
Enrollment by Age
Under 18
0%
18 – 19
8%
20 – 21
17%
22 – 24
20%
25 – 29
22%
30 – 34
13%
35 – 39
7%
40 – 49
9%
50 – 64
3%
65 and over
1%
Summer 2010
Summer 2010 Summer 2009 Inc/Dec %Change
Number Percent Number Percent Number Percent
Age Unknown
0 0%
0 0%
0 0.0%
Under 18
17 0% 18 0%
-1 -5.6%
18 – 19
617 8% 570 8% 47 8.2%
20 – 21
1,277 17% 1,114 15% 163 14.6%
22 – 24
1,472 20% 1,319 18% 153 11.6%
25 – 29
1,682 23% 1,465 20% 217 14.8%
30 – 34
951 13% 783 11% 168 21.5%
35 – 39
542 7% 488 7% 54 11.1%
40 – 49
632 8% 540 7% 92 17.0%
50 – 64
240 3% 218 3% 22 10.1%
65 and over
19 1% 28 1%
-9 -32.1%
Total
7,449 100% 6,543 100% 906 13.8%
Average Age
28.0
28.2
6/18/2010
3
Office of Institutional Research
Enrollment by Campus & Parish
0
2,000
4,000
6,000
Enrollment by Campus
Summer 2010
Summer 2009
0
1,000
2,000
3,000
Enrollment by Parish
Summer 2010
Summer 2009
Campus
Summer 2010 Summer 2009 Inc/Dec %Change
Number Percent Number Percent Number Percent
City Park Campus
4,858 65% 4,226 57% 632 15.0%
West Bank Campus 1,420 19% 1,356 18% 64 4.7%
Northshore Campus 1,049 14% 872 12% 177 20.3%
Charity School of Nursing 122 2% 89 1% 33 37.1%
Total
7,449 100% 6,543 88% 906 13.8%
Top Ten Parishes
Summer 2010 Summer 2009 Inc/Dec %Change
Number Percent Number Percent Number Percent
Orleans
2,165 29% 1,841 25% 324 17.6%
Jefferson
2,607 35% 2,406 32% 201 8.4%
St. Tammany
1,208 16% 1,079 14% 129 12.0%
St. Charles
207 3% 204 3%
3 1.5%
St. John
155 2% 138 2% 17 12.3%
St. Bernard
80 1% 75 1%
5 6.7%
Plaquemines
91 1% 73 1% 18 24.7%
Lafourche
44 1% 51 1%
-7 -13.7%
Terrebonne
29 0% 42 1%
-13 -31.0%
St.
James
18
1% 21
1%
-3 -14.3%
Other
845 11% 613 8% 232 37.8%
Total
7,449 100% 6,543 100% 906 13.8%
0
2,000
4,000
6,000
Enrollment by Campus
Summer 2010
Summer 2009
0
1,000
2,000
3,000
Enrollment by Parish
Summer 2010
Summer 2009
6/18/2010
4
Office of Institutional Research
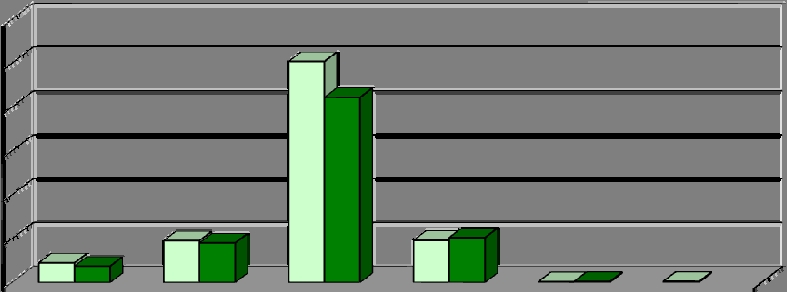
One College Division
Inc/Dec %Change
Number Percent Number Percent Number Percent
Allied Health
1,709 23%
1,350 18%
359 26.6%
Enrollment by Division and Award
Summer 2009
Summer 2010
23%
21%
24%
2%
1%
29%
Summer 2010
A
llied Health
Arts & Humanites
Business & Technology
Charity School of Nursing
Communications
Science & Math
Allied
Health
1,709
23%
1,350
18%
359
26.6%
Arts & Humanites
1,586 21% 1,351 18%
235 17.4%
Business & Technology
1,744 23% 1,680 23%
64 3.8%
Charity School of Nursing 122 2% 89 1% 33 37.1%
Communications
101 1% 118 2%
-17 -14.4%
Science & Math
2,187 29% 1,955 26%
232 11.9%
College Total
7,449 100% 6,543 88%
906 13.8%
Inc/Dec %Change
Number Percent Number Percent Number Percent
Associate - 2 yr
5834 78% 5039 68%
795 15.8%
Post-Associate Cert
117 2%
0 0%
117 0.0%
Certificate - 1 yr
564 8% 580 8%
-16 -2.8%
Diploma
145 2% 95 1%
50 52.6%
Non-degree seeking
789 11% 829 11%
-40 -4.8%
College Total
7,449
100%
6,543
88%
906 13.8%
*Basic Education contains non-degree seeking students.
Enrollmet by Award
Summer 2010 Summer 2009
23%
21%
24%
2%
1%
29%
Summer 2010
A
llied Health
Arts & Humanites
Business & Technology
Charity School of Nursing
Communications
Science & Math
6/18/2010
5
Office of Institutional Research
Enrollment by Admission Status & Classification
0
1,000
2,000
3,000
4,000
5,000
6,000
First-Time Freshmen
Transfer Students
Continuing Students
Readmitted Students
Exchange StudentsOther
Admission Status
Summer 2010
Summer 2009
0
2,000
4,000
Classification
Admission Status Summer 2010 Summer 2009 Inc/Dec %Change
Number Percent Number Percent Number Percent
First-Time Freshmen 448 6% 373 5% 75 20.1%
Transfer Students
955 13% 903 12% 52 5.8%
Continuing Students 5,038 68% 4,221 57% 817 19.4%
Readmitted Students 963 13% 1,023 14%
-60 -5.9%
Exchange Students
19 0% 23 0%
-4 -17.4%
Other
26 0%
N/A N/A
Total
7,449 100% 6,543 88% 906 13.8%
Classification
Summer 2010 Summer 2009 Inc/Dec %Change
Number Percent Number Percent Number Percent
Freshmen
3,761 50% 3,120 42% 641 20.5%
Sophomore
1,710 23% 1,560 21% 150 9.6%
Other Undergraduate 1,966 26% 1,848 25% 118 6.4%
Preparatory
12 0% 15 0%
-3 -20.0%
Total
7,449 100% 6,543 88% 906 13.8%
0
1,000
2,000
3,000
4,000
5,000
6,000
First-Time Freshmen
Transfer Students
Continuing Students
Readmitted Students
Exchange StudentsOther
Admission Status
Summer 2010
Summer 2009
0
2,000
4,000
Freshmen Sophomore
Other Undergraduate
Preparatory
Classification
Summer 2010
Summer 2009
6/18/2010
6
Office of Institutional Research
Top Ten Most Popular Majors
24%
10%
6%
6%
4%
4%
3%
3%
3%
2%
35%
Summer 2010
Pre-Nursing
General Studies
Radiologic Technology
Business Administration
General Science
Business & Management
Criminal Justice
Accounting
Physical Therapist Assistant
Care & Development of
Young Children
Other Majors
Top Ten Most Popular Majors
Summer 2010 Summer 2009
Number Percent Number Percent
Pre-Nursing 1,773 24% 1,626 22%
General Studies
775 10% 671 9%
Radiologic Technology
449 6% 382 5%
Business Administration
430
6%
415
6%
General Science
329 4% 276 4%
Business & Management
315 4% 252 3%
Criminal Justice
229 3% 197 3%
Accounting
208
3%
211
3%
Physical Therapist Assistant
185 2% 120 2%
Care & Development of Young Child
170 2% 149 2%
Other Majors 2,586
35%
2,244
30%
Total
7,449 100.0% 6,543 87.8%
24%
10%
6%
6%
4%
4%
3%
3%
3%
2%
35%
Summer 2010
Pre-Nursing
General Studies
Radiologic Technology
Business Administration
General Science
Business & Management
Criminal Justice
Accounting
Physical Therapist Assistant
Care & Development of
Young Children
Other Majors
6/18/2010
7
Office of Institutional Research
College Wide
Inc/
Percent
Number Percent Number Percent Dec Change
No. of students taking a web class
2,306 31.0%
1,925 29.4%
381 19.8%
Students taking only web classes
1,076 14.4%
983 15.0%
93 9.5%
Average no. of web courses taken
1.4 0.0%
1.4 0.0%
0
0.4%
Students in only F2F* classes
5,143 69.0%
4,618 70.6%
525 11.4%
Total
7,449 100.0%
6,543 100.0%
906 13.8%
*: F2F = Face to Face
Note: Percentages will not add up to 100%.
City Park
Inc/
Percent
Number Percent Number Percent Dec Change
No. of students taking a web class
1,575 32.4%
1,334 31.6%
241 18.1%
Students taking only web classes
792 16.3%
734 17.4%
58 7.9%
Average no. of web courses taken
1.5 0.0%
1.5 0.0%
0 -1.4%
Students in only F2F classes
3,283 67.6%
2,892 68.4%
391 13.5%
Total
4,858 100.0%
4,226 100.0%
632 15.0%
West Bank
Inc/
Percent
Number Percent Number Percent Dec Change
No. of students taking a web class
408 28.7%
347 25.6%
61 17.6%
Students taking only web classes
181 12.7%
152 11.2%
29 19.1%
A
f b k
14
0 1%
13
0 1%
0
5 4%
Summer 2009
Summer 2010
Summer 2009
Summer 2010 Enrollment by Online Status
Summer 2010
Summer 2009
Summer 2010
Average no. of web courses taken
1.4 0.1%
1.3 0.1%
0
5.4%
Students in only F2F classes
1,012 71.3%
1,009 74.4%
3
0.3%
Total
1,420 100.0%
1,356 100.0%
64 4.7%
Charity School of Nursing
Inc/
Percent
Number Percent Number Percent Dec Change
No. of students taking a web class
2 1.6%
1 1.1%
1 100.0%
Students taking only web classes
1 0.8%
0 0.0%
1
0.0%
Average no. of web courses taken
1.0 0.8%
1.0 1.1%
0
0.0%
Students in only F2F classes
120 98.4%
88 98.9%
32 36.4%
Total
122 100.0%
89 100.0%
33 37.1%
Northshore site
Inc/
Percent
Number Percent Number Percent Dec Change
No of students taking a web class
321 30.6%
243 27.9%
78 32.1%
Students taking only web classes
102 9.7%
97 11.1%
5
5.2%
Average no. of web courses taken
1.3 0.1%
1.3 0.1%
0
1.6%
Students in only F2F classes
728 69.4%
629 72.1%
99 15.7%
Total
1,049 100.0%
872 100.0%
177 20.3%
Summer 2010
Summer 2009
Summer 2010
Summer 2009
6/18/2010
8
Office of Institutional Research
Prefix
Program
Number Percent
NURS Pre-Nursing
1,773 23.8%
GSTD General Studies
775 10.4%
RADT Radiologic Technology
449 6.0%
BUAD Business Administration
430
5.8%
GSCI General Science
329 4.4%
BUMG Business & Management
315 4.2%
CRJU Criminal Justice
229 3.1%
ACCT Accounting
208
2.8%
PTAP Physical Therapist Assistant
185 2.5%
CDYC Care & Development of Young Children
170 2.3%
RSPT Respiratory Care Technology
138 1.9%
TEAC Teaching Grades 1-5
134 1.8%
SURG Surgical Technology
129 1.7%
MEDC Medical Coding
116 1.6%
PHAR Pharmacy Technician
116 1.6%
CULA Culinary Arts
106 1.4%
EMTE Emergency Medical Technology
105 1.4%
CMIN Computer Information Technology
96 1.3%
PRPN Pre-Practical Nursing
85 1.1%
MLTS Medical Laboratory Technician
82 1.1%
ELET Electrical - Electronics Engineering Technology
79 1.1%
FNAR Fine Arts
77 1.0%
PFMA Performance and Media Arts
77 1.0%
DMSU Diagnostic Medical Sonography
73 1.0%
MOVH Motor Vehicle Technology
72 1.0%
CADD
Computer Aided Drafting & Design
71
1 0%
Summer 2010
Enrollment by Program - Ranked by Enrollment
CADD
C
omputer Aided Drafting & Design
71
1.0%
ESLN English as a Second Language
67 0.9%
NURS Nursing
63 0.8%
VETT Veterinary Technology
63 0.8%
PRNU Practical Nursing
59 0.8%
OCTA Occupational Therapy Assistant
55 0.7%
MUSC Music
49 0.7%
6/18/2010
9
Office of Institutional Research
Prefix
Program
Number Percent
HEIT Health Information Technology
47 0.6%
VISC Visual Communications
44 0.6%
ADCT
Architectural/Design Construction Technology
43 0.6%
ADOT Administrative Office Technology
42
0.6%
DIET Dietetic Technician
39 0.5%
CNET Computer Network Technology
38 0.5%
FSED Funeral Service Education
38 0.5%
HOST Hospitality
36 0.5%
INTD Interior Design
31 0.4%
RATH Radiation Therapy -Certificate
31 0.4%
FPTC Fire Protection Technology
27 0.4%
ASLS American Sign Language Studies
20
0.3%
LEGS Legal Secretary
19 0.3%
MSTH Massage Therapy
19 0.3%
CTCM
Construction Engineering Technology-Construction Management
17 0.2%
ELCO Electrical Construction Technology
17 0.2%
ESCR Electronics Servicing Technology-Computer Repair
17 0.2%
ESBI
Electronics Servicing Technology-Biomedical Equipment Repair
16 0.2%
NUMT Nuclear Medicine Technology
16 0.2%
CUPA
Culinary Arts -Pastry Assistant
14 0.2%
EDIF Educational Interpreting for the Deaf
14 0.2%
WSDE Website Developer
14 0.2%
CMRP Computer Repair
12 0.2%
CTCC
Civil Construction Technology
12 0.2%
SFTY
Safety and Health Technology
12
0 2%
Summer 2010
Enrollment by Program - Ranked by Enrollment
SFTY
S
afety and Health Technology
12
0.2%
CUCT Culinary Arts - Catering
10 0.1%
ENTE Entrepreneurship
10 0.1%
HORT Horticulture 8 0.1%
OPHT Ophthalmic Medical Assistant
8 0.1%
ENST
Environmental Studies-Built Environments
1
0.0%
SMAP
Sheet metal Apprentice
1
0.0%
WKFD Workforce Development
1 0.0%
RLST Real Estate Agent
0 0.0%
Total
7,449 100%
6/18/2010
10
Office of Institutional Research
Prefix
Program
Inc/
Percent
2010 2009
Dec Change
ACCT Accounting
208 211
-3 -1%
ADOT Administrative Office Technology
42 36
6 17%
ASLS American Sign Language Studies
20 15
5 33%
BUAD Business Administration
430 415
15 4%
BUMG Business & Management
315 252 63 25%
CADD Computer Aided Drafting & Design
71 78
-7 -9%
CDYC Care & Development of Young Children
170 149 21 14%
CMIN Computer Information Technology
96 93 3 3%
CMRP Computer Repair
12 6 6 100%
CNET Computer Network Technology
38 35 3 9%
ADCT
Architectural/Design Construction Technology
43 48
-5 -10%
CTCC
Civil Construction Technology
12 13
-1 -8%
CTCM
Management
17 30
-13 -43%
CRJU Criminal Justice
229 197 32 16%
CUCT Culinary Arts - Catering
10 12
-2 -17%
CULA Culinary Arts
106 94 12 13%
CUPA
Culinary Arts -Pastry Assistant
14 2 12 600%
DIET Dietetic Technician
39 29 10 34%
DMSU Diagnostic Medical Sonography
73 57 16 28%
EDIF Educational Interpreting for the Deaf
14 13 1 8%
ELCO Electrical Construction Technology
17 19
-2 -11%
ELET Electrical - Electronics Engineering Technology
79 72 7 10%
EMTE Emergency Medical Technology
105 94 11 12%
ENTE Entrepreneurship
10 4 6 150%
ENST
Environmental Studies-Built Environments
1
N/A N/A
ESBI
Electronics Servicing Technology-Biomedical Equipment Repair
16 9 7 78%
ESCR Electronics Servicing Technology-Computer Repair
17 15 2 13%
ESLN English as a Second Language
67 90
-23 -26%
FNAR Fine Arts
77 69 8 12%
FPTC Fire Protection Technology
27 64
-37 -58%
FSED Funeral Service Education
38 26 12 46%
GSCI General Science
329 276 53 19%
GSTD General Studies
775 671 104 15%
HEIT
H
l h I f i T h
l
4
40
18%
College Wide Enrollment by Program
Summer
HEIT Health Information Technology
47 40 7 18%
HORT Horticulture 8 6 2 33%
HOST Hospitality
36 27 9 33%
INTD Interior Design
31 24 7 29%
LEGS Legal Secretary
19 13 6 46%
MEDC Medical Coding
116 79 37 47%
MLTS Medical Laboratory Technician
82 56 26 46%
MOVH Motor Vehicle Technology
72 42 30 71%
MSTH Massage Therapy
19 23
-4 -17%
MUSC Music
49 37 12 32%
NUMT Nuclear Medicine Technology
16 13 3 23%
NURS Pre-Nursing
1,773 1,626 147 9%
NURS Nursing
63 47 16 34%
OCTA Occupational Therapy Assistant
55 36 19 53%
OPHT Ophthalmic Medical Assistant
8 2 6 300%
PFMA Performance and Media Arts
77 63 14 22%
PHAR Pharmacy Technician
116 95 21 22%
PRPN Pre-Practical Nursing
85 95
-10 -11%
PRNU Practical Nursing
59 95
-36 -38%
PTAP Physical Therapist Assistant
185 120 65 54%
RADT Radiologic Technology
449 382 67 18%
RATH Radiation Therapy -Certificate
31 16 15 94%
RLST Real Estate Agent
0 0 0 0%
RSPT Respiratory Care Technology
138 113 25 22%
SFTY Safety and Health Technology
12 17
-5 -29%
SMAP
Sheet metal Apprentice
1
N/A N/A
SURG Surgical Technology
129 115 14 12%
TEAC Teaching Grades 1-5
134 103 31 30%
VETT Veterinary Technology
63 54 9 17%
VISC Visual Communications
44 38 6 16%
WSDE Website Developer
14 16
-2 -13%
WKFD Workforce Development
1 51
-50 -98%
Total
7,449 6,638 811 12.2%
6/18/2010
11
Office of Institutional Research
Prefix
Program
Inc/ Percent
2010 2009
Dec Change
ACCT Accounting
147 136 11 8%
ADOT Administrative Office Technology
28 28 0 0%
ASLS American Sign Language Studies
18 12 6 50%
BUAD Business Administration
316 318
-2 -1%
BUMG Business & Management
228 187 41 22%
CADD Computer Aided Drafting & Design
41 47
-6 -13%
CDYC Care & Development of Young Children
111 93 18 19%
CMIN Computer Information Technology
67 59 8 14%
CMRP Computer Repair
7 3 4 133%
CNET Computer Network Technology
27 28
-1 -4%
ADCT
Architectural/Design Construction Technology
34 44
-10 -23%
CTCC
Civil Construction Technology
12 11 1 9%
CTCM
Construction Engineering Technology-Construction Management
17 24
-7 -29%
CRJU Criminal Justice
158 124 34 27%
CUCT Culinary Arts - Catering
8 11
-3 -27%
CULA Culinary Arts
95 76 19 25%
CUPA
Culinary Arts -Pastry Assistant
11 2 9 450%
DIET Dietetic Technician
33 25 8 32%
DMSU Diagnostic Medical Sonography
56 37 19 51%
EDIF Educational Interpreting for the Deaf
14 12 2 17%
ELCO Electrical Construction Technology
15 16
-1 -6%
ELET Electrical - Electronics Engineering Technology
58 52 6 12%
EMTE Emergency Medical Technology
95 65 30 46%
ENST
Environmental Studies-Built Environments
1
N/A N/A
ENTE Entrepreneurship
8 2 6 300%
ESBI
Electronics Servicing Technology-Biomedical Equipment Repair
12 8 4 50%
ESCR Electronics Servicing Technology-Computer Repair
13 11 2 18%
ESLN English as a Second Language
65 89
-24 -27%
FNAR Fine Arts
43 46
-3 -7%
FPTC Fire Protection Technology
21 58
-37 -64%
FSED Funeral Service Education
23 19 4 21%
GSCI General Science
219 195 24 12%
GSTD
General Studies
493
417
76
18%
Summer
City Park Campus Enrollment by Program
GSTD
G
eneral Studies
493
417
76
18%
HEIT Health Information Technology
34 28 6 21%
HORT Horticulture 5 5 0 0%
HOSM Hospitality Management
31 23 8 35%
INTD Interior Design
29 23 6 26%
LEGS Legal Secretary
12 11 1 9%
MEDC Medical Coding
79 59 20 34%
MLTS Medical Laboratory Technician
57 37 20 54%
MOVH Motor Vehicle Technology
63 39 24 62%
MSTH
Massage Therapy
4 1 3 300%
MUSC Music
40 30 10 33%
NUMT Nuclear Medicine Technology
12 11 1 9%
NURS Pre-Nursing
1,034 922 112 12%
OCTA Occupational Therapy Assistant
39 28 11 39%
OPHT Ophthalmic Medical Assistant
5 2 3 150%
PFMA Performance and Media Arts
59 46 13 28%
PHAR Pharmacy Technician
74 60 14 23%
PRPN Pre-Practical Nursing
54 35 19 54%
PTAP Physical Therapist Assistant
119 78 41 53%
RADT Radiologic Technology
281 250 31 12%
RATH Radiation Therapy -Certificate
22 10 12 120%
RLST Real Estate Agent
0 0 0 0%
RSPT Respiratory Care Technology
75 56 19 34%
SFTY Safety and Health Technology
11 13
-2 -15%
SMAP
Sheet metal Apprentice
1
N/A N/A
SURG Surgical Technology
77 69 8 12%
TEAC Teaching Grades 1-5
74 72 2 3%
VETT Veterinary Technology
31 28 3 11%
VISC Visual Communications
32 25 7 28%
WSDE Website Developer
10 10 0 0%
WKFD Workforce Development
0 0 0 0%
Total
4,858 4,226 632 15.0%
6/18/2010
12
Office of Institutional Research
Prefix
Program
Inc/ Percent
2010 2009
Dec Change
ACCT Accounting
48 58
-10 -17%
ADOT Administrative Office Technology
10 7 3 43%
ASLS American Sign Language Studies
1 3
-2 -67%
BUAD Business Administration
76 58 18 31%
BUMG Business & Management
50 41 9 22%
CADD Computer Aided Drafting & Design
24 23 1 4%
CDYC Care & Development of Young Children
49 39 10 26%
CMIN Computer Information Technology
19 23
-4 -17%
CMRP Computer Repair
4 3 1 33%
CNET Computer Network Technology
10 5 5 100%
ADCT
Architectural/Design Construction Technology
6 2 4 200%
CTCC
Civil Construction Technology
0
1
-1 -100%
CTCM
Construction Engineering Technology-Construction Management
0
4
-4 0%
CRJU Criminal Justice
48 49
-1 -2%
CUCT Culinary Arts - Catering
2 0 2 0%
CULA Culinary Arts
7 11
-4 -36%
CUPA
Culinary Arts -Pastry Assistant
2
0
2 0%
DIET Dietetic Technician
1 2
-1 -50%
DMSU Diagnostic Medical Sonography
9 12
-3 -25%
EDIF Educational Interpreting for the Deaf
0 1
-1 -100%
ELCO Electrical Construction Technology
1 3
-2 -67%
ELET Electrical - Electronics Engineering Technology
11 10 1 10%
EMTE Emergency Medical Technology
1 6
-5 -83%
ESLN English as a Second Language
2 0 2 0%
ENTE Entrepreneurship
1 2
-1 -50%
ENST
Environmental Studies-Built Environments
0
N/A N/A
ESBI
Electronics Servicing Technology-Biomedical Equipment Repair
3
0
3 0%
ESCR Electronics Servicing Technology-Computer Repair
2 2 0 0%
FNAR Fine Arts
23 16 7 44%
FPTC Fire Protection Technology
0 1
-1 0%
FSED Funeral Service Education
10 5 5 100%
GSCI General Science
73 63 10 16%
GSTD General Studies
145 126 19 15%
HEIT
Health Information Technology
5
8
3
38%
Summer
West Bank Campus Enrollment by Program
HEIT
Health Information Technology
5
8
-3
-38%
HORT Horticulture 1 1 0 0%
HOST Hospitality 4 3 1 33%
INTD Interior Design 2 1 1 100%
LEGS Legal Secretary 4 1 3 300%
MEDC Medical Coding 23 11 12 109%
MLTS Medical Laboratory Technician 16 12 4 33%
MOVH Motor Vehicle Technology 4 2 2 100%
MSTH
Massage Therapy
14 22
-8 -36%
MUSC Music
5 5 0 0%
NUMT Nuclear Medicine Technology
2 1 1 0%
NURS Pre-Nursing
424 448
-24 -5%
OCTA Occupational Therapy Assistant
8 5 3 60%
OPHT Ophthalmic Medical Assistant
0 0 0 0%
PFMA Performance and Media Arts
16 12 4 33%
PHAR Pharmacy Technician
22 17 5 29%
PRPN Pre-Practical Nursing
19 13 6 46%
PTAP Physical Therapist Assistant
33 26 7 27%
RADT Radiologic Technology
83 60 23 38%
RATH Radiation Therapy -Certificate
5 2 3 150%
RSPT Respiratory Care Technology
25 32
-7 -22%
SFTY Safety and Health Technology
1 4
-3 -75%
SMAP
Sheet metal Apprentice
0
N/A N/A
SURG Surgical Technology
14 15
-1 -7%
TEAC Teaching Grades 1-5
32 15 17 113%
VETT Veterinary Technology
9 5 4 80%
VISC Visual Communications
8 6 2 33%
WSDE Website Developer
3 3 0 0%
WKFD Workforce Development
0 50
-50 -100%
Total
1,420 1,356 64 4.7%
Prefix
Program
Inc/ Percent
210 2009
Dec Change
NURS Nursing
63 47 16 34%
PRNU Practical Nursing
59 42 17 40%
Total
122 89 33 37.1%
Charity Campus Enrollment by Program
Summer
6/18/2010
13
Office of Institutional Research
Prefix
Program
Inc/ Percent
2010 2009
Dec Change
ACCT Accounting
13 17 -4 -24%
ADOT Administrative Office Technology
4 1
3 300%
ASLS American Sign Language Studies
1 0 1 0%
BUAD Business Administration
38 39
-1 -3%
BUMG Business & Management
37 24 13 54%
CADD Computer Aided Drafting & Design
6 8 -2 -25%
CDYC Care & Development of Young Children
10 17 -7 -41%
CMIN Computer Information Technology
10 11 -1 -9%
CMRP Computer Repair
1 0 1 0%
CNET Computer Network Technology
1 2 -1 -50%
ADCT
Architectural/Design Construction Technology
3
2
1 0%
CTCC
Civil Construction Technology
0 1 -1 -100%
CTCM
Construction Engineering Technology-Construction Management
0
2 -2 0%
CRJU Criminal Justice
23 24 -1 -4%
CUCT Culinary Arts - Catering
0 1 -1 -100%
CULA Culinary Arts
4 7 -3 -43%
CUPA
Culinary Arts -Pastry Assistant
1
0
1 0%
DIET Dietetic Technician
5 2 3 150%
DMSU Diagnostic Medical Sonography
8 8 0 0%
EDIF Educational Interpreting for the Deaf
0 0 0 0%
ELCO Electrical Construction Technology
1 0
1
#DIV/0!
ELET Electrical - Electronics Engineering Technology
10 10 0 0%
EMTE Emergency Medical Technology
9 23 -14 -61%
ENST
Environmental Studies-Built Environments
0
N/A N/A
ENTE Entrepreneurship
1 0
1
#DIV/0!
ESBI
Electronics Servicing Technology-Biomedical Equipment Repair
1
1
0 0%
ESCR Electronics Servicing Technology-Computer Repair
2 2 0 0%
ESLN English as a Second Language
0 1 -1 0%
FNAR Fine Arts
11 7 4 57%
FPTC Fire Protection Technology
6 5 1 20%
FSED Funeral Service Education
5 2 3 150%
GSCI General Science
37 18 19 106%
GSTD
General Studies
137
128
9
7%
Summer
Northshore Site Enrollment by Program
GSTD
G
eneral Studies
137
128
9
7%
HEIT Health Information Technology
8 4 4 100%
HORT Horticulture 2 0 2
0%
HOST Hospitality
1 1
0
0%
INTD Interior Design
0 0
0
#DIV/0!
LEGS Legal Secretary
3 1 2
0%
MEDC Medical Coding
14 9 5 56%
MLTS Medical Laboratory Technician
9 7 2 29%
MOVH Motor Vehicle Technology
5 1
4 400%
MSTH Massage Therapy
1
0
1
#DIV/0!
MUSC Music
4 2 2 100%
NUMT Nuclear Medicine Technology
2 1
1 100%
NURS Pre-Nursing
315 256 59 23%
OCTA Occupational Therapy Assistant
8 3
5 167%
OPHT Ophthalmic Medical Assistant
3 0
3
#DIV/0!
PFMA Performance and Media Arts
2 5 -3 -60%
PHAR Pharmacy Technician
20 18 2 11%
PRPN Pre-Practical Nursing
12 5 7 140%
PTAP Physical Therapist Assistant
33 16 17 106%
RADT Radiologic Technology
85 72 13 18%
RATH Radiation Therapy -Certificate
4 4 0 0%
RSPT Respiratory Care Technology
38 25 13 52%
SFTY Safety and Health Technology
0 0 0 0%
SMAP
Sheet metal Apprentice
0
N/A N/A
SURG Surgical Technology
38 31 7 23%
TEAC Teaching Grades 1-5
28 16 12 75%
VETT Veterinary Technology
23 21 2 10%
VISC Visual Communications
4 7 -3 -43%
WSDE Website Developer
1 3 -2 0%
WKFD Workforce Development
1 1 N/A N/A
Total
1,049 872 177 20.3%
6/18/2010
14
Office of Institutional Research
Rank
School
Number
Percent Number
Percent Inc/Dec % Change
2010 2009
TOTAL First Time Freshmen 448 373 75 20.1%
1 Alcee Fortier
5 1% 1 0% 4 400%
2 Alfred T Bonnabel
6
1%
6
1% 0 0%
3 Amite High School
1
0% 1
0% 0 0%
4 Andrew Jackson Fundamental
1
0%
1
0% 0 0%
5 Archbishop Chapelle
4
1%
1
0% 3 300%
6 Archbishop Rummel
3
1%
0
0% 3 0%
7 Belle Chasse
2
0%
5
1%
-3 -60%
8 Bogalusa Hs West
1
0%
2
0%
-1 -50%
9 Buras
2
0%
0
0% 2 0%
10 Chalmette
1
0%
1
0% 0 0%
11 Covington
3
1%
7
2%
-4 -57%
12 Destrehan
6
1%
5
1% 1 20%
13 East Jefferson
3
1%
4
1%
-1 -25%
14 East Saint John
6
1%
5
1% 1 20%
15 Ecole Classique
3
1%
0
0% 3 0%
16 Edna Karr Magnet
5
1%
3
1% 2 67%
17 Fountainebleau High
7
2%
4
1% 3 75%
18 FT Nicholls
5
1%
1
0% 4 400%
19 George W Carver Sr
3
1%
2
0% 1 50%
20 Grace King
6
1%
7
2%
-1 -14%
21 Hahnville
6
1%
5
1% 1 20%
22 Hammond High
5
1%
2
0% 3 150%
23 Heritage Academy
2
0%
0
0% 2 0%
24 Indepencdence High School
2
0%
0
0% 2 0%
25 John Ehret
12
3%
8
2% 4 50%
26 John F Kennedy Senior
6
1%
4
1% 2 50%
27 John Mcdonogh Senior
5
1%
2
0% 3 150%
28
1%
1%
1
25%
Top 50 "Feeder" High Schools
28 JS Clark Senior
3
1%
4
1%
-1 -25%
29 LB Landry
3
1%
0
0% 3 0%
30 Le Rabouin Voc
8
2%
7
2% 1 14%
31 Lutcher
3
1%
0
0% 3 0%
32 Lw Higgins
5
1%
11
2%
-6 -55%
33 Mandeville
4
1%
4
1% 0 0%
34 Mc Donogh 35 Senior
2
0%
5
1%
-3 -60%
35 Mc Main Magnet
4
1%
2
0% 2 100%
36 Mount Carmel Academy
3
1%
0
0% 3 0%
37 New Orleans Science/ Math HS
2
0%
1
0% 1 100%
38 Northlake Christian School
2
0%
1
0% 1 100%
39 Northshore
6
1%
15
3%
-9 -60%
40 O Perry Walker Senior
5
1%
3
1% 2 67%
41 Pearl River
7
2%
2
0% 5 250%
42 Ponchatoula High
5
1%
2
0% 3 150%
43 Riverdale
7
2%
5
1% 2 40%
44 Saint Mary's Domincan
3
1%
0
0% 3 0%
45 Salmen
10
2%
6
1% 4 67%
46 Sarah Reed
3
1%
4
1%
-1 -25%
47 Slidell
8
2%
8
2% 0 0%
48 Walter L Cohen
3
1%
3
1% 0 0%
49 Warren Easton Fundamental
5
1%
5
1% 0 0%
50 West Jefferson
4
1%
7
2%
-3 -43%
GED
99 22% 76 17% 23 30%
Foreign High School
22 5% 12 3% 10 83%
Non-High School Grads
29 6% 24 5% 5 21%
Out of State
17 4% 10 2% 7 70%
Unknown
4
1%
3
1%
1
33%
6/18/2010
15
Office of Institutional Research
Enrollment by Zip Code
Zip Code
Summer
2010
Percent
Summer
2009
Percent Inc/Dec
%
Change
Metairie S of I-10
70001
245
4%
217
3% 28 13%
Metairie
70002
133
2%
106
2% 27 25%
West Metairie
70003
224
4%
218
3% 6 3%
Old Metairie-Bucktown
70005
115
2%
126
2%
-11 -9%
Metairie Clearview N of I-10 70006
87
1%
87
1% 0 0%
Belle Chasse
70037
79
1%
71
1% 8 11%
Chalmette
70043
39
1%
31
0% 8 26%
Gretna
70053
93
1%
69
1% 24 35%
Gretna/S of Whitney
70056
288
5%
250
4% 38 15%
Harvey
70058
373
6%
310
5% 63 20%
South Kenner
70062
93
1%
80
1% 13 16%
North Kenner
70065
292
5%
291
5% 1 0%
LaPlace
70068
155
2%
135
2% 20 15%
Marrero
70072
441
7%
376
6% 65 17%
Westwego
70094
229
4%
219
3% 10 5%
Algiers
70114
178
3%
154
2% 24 16%
Uptown
70115
123
2%
115
2% 8 7%
French Quarter-Marigny
70116
59
1%
52
1% 7 13%
Bywater/Lower 9th Ward
70117
134
2%
101
2% 33 33%
Carrollton/Riverbend
70118
143
2%
107
2% 36 34%
Mid City
70119
252
4%
182
3% 70 38%
N.O. Postal Box Zone
70121
64
1%
53
1% 11 21%
Lakefront/Gentilly
70122
211
3%
165
3% 46 28%
Harahan-Jefferson
70123
131
2%
131
2% 0 0%
Lakefront/Lakeview
70124
96
2%
80
1%
16
20%
Lakefront/Lakeview
70124
96
2%
80
1%
16
20%
Broadmoor
70125
62
1%
56
1% 6 11%
N.O. East Crowder
70126
182
3%
147
2% 35 24%
N.O. East Crowder to Wright Rd 70127
164
3%
110
2% 54 49%
N.O. East Wright Rd to I-510 70128
139
2%
125
2% 14 11%
N.O. East Past I-510
70129
68
1%
61
1% 7 11%
N.O. CBD-Lwr Garden District 70130
54
1%
44
1% 10 23%
Lower Coast Algiers
70131
224
4%
202
3% 22 11%
St. Tammany
70420
20
0%
34
1%
-14 -41%
Washington
70427
35
1%
37
1%
-2 -5%
Covington 70433
107
2%
127
2%
-20 -16%
Covington
70435
66
1%
77
1%
-11 -14%
St. Tammany
70445
51
1%
52
1%
-1 -2%
St. Tammany 70448
93
1%
92
1% 1 1%
St. Tammany
70452
63
1%
43
1% 20 47%
Slidell
70458
258
4%
193
3% 65 34%
Slidell
70460
175
3%
159
3% 16 10%
Slidell
70461
197
3%
183
3% 14 8%
St. Tammany
70471
85
1%
59
1% 26 44%
Subtotal
6320 84.8% 5527 74.2% 793 14.3%
Other Louisiana
1085 14.6% 970 13.0% 115 11.9%
Total Louisiana
7405 99.4% 6497 87.2% 908 14.0%
Out-of-State
44 0.6% 46 0.6%
-2 -4.3%
Total
7449 100% 6543 88% 906 13.8%
6/18/2010
16
Office of Institutional Research