Fall 2010 Cohort
as of Fall 2011
Office
of
Institutional
Research
First time,
full time
associate degree seeking
students
2,263
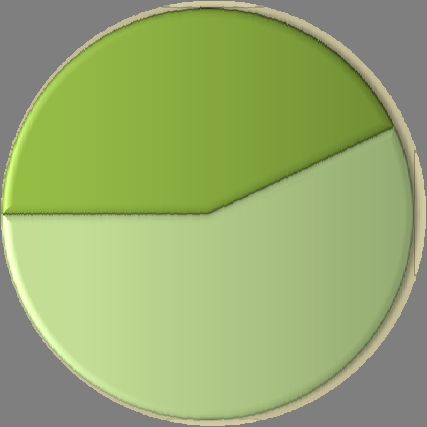
Gender
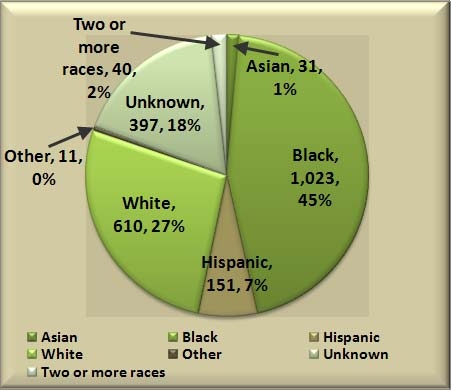
Ethnicity
Female,
1,340,
59%
Male,
923,
41%
Female
Male
Student Demographics
Student Major
391
485
48 52
101
418
57
338
373
0
100
200
300
400
500
Student Demographics
Age Group
31
1,349
322
200
176
93 35 35 22
0
200
400
600
800
1,000
1,200
1,400
LESS
THAN
18
18
‐
19
20
‐
21
22
‐
24
25
‐
29
30
‐
34
35
‐
39
40
‐
49
OVER
50
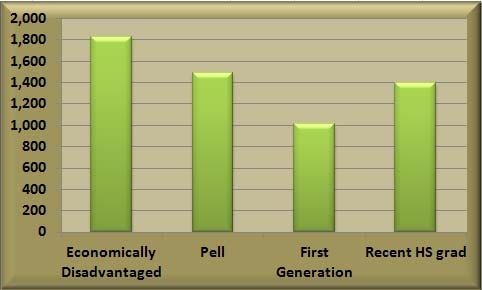
Special Populations
Student Demographics
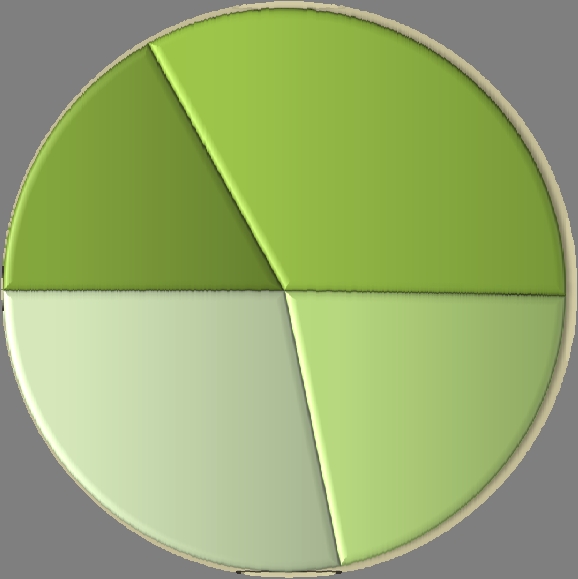
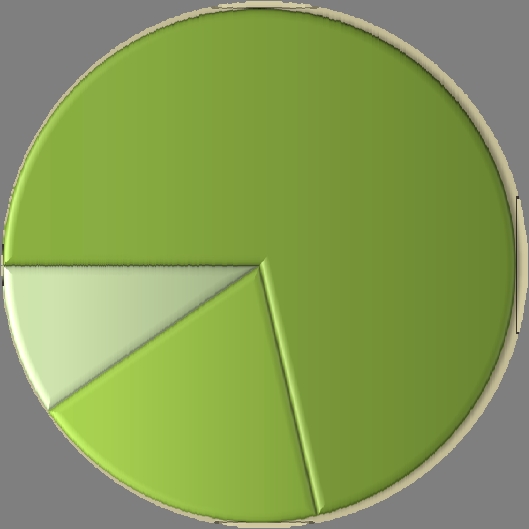
83 % are in at least 1 developmental class, 28% are in 3 or more
Developmental Status
None,
384,
17%
1
Dev
Class,
754,
33%
2
Dev
Classes,
487,
22%
3+
Dev
Classes,
638,
28%
None
1
Dev
Class
2
Dev
Classes
3+
Dev
Classes
57% are in highest
Developmental Reading
75% are in the highest
Developmental English
READ
071,
303,
43%
READ
072,
401,
57%
READ
071
READ
072
ENGL
060,
40,
4%
ENGL
061,
230,
21%
ENGL
062,
810,
75%
ENGL
060
ENGL
061
ENGL
062
Developmental Level
Math - 71% are in the lowest
Developmental Math
MATH
090,091,
1,288,
71%
MATH
095,
344,
19%
MATH
096,
173,
10%
MATH
090,091
MATH
095
MATH
096
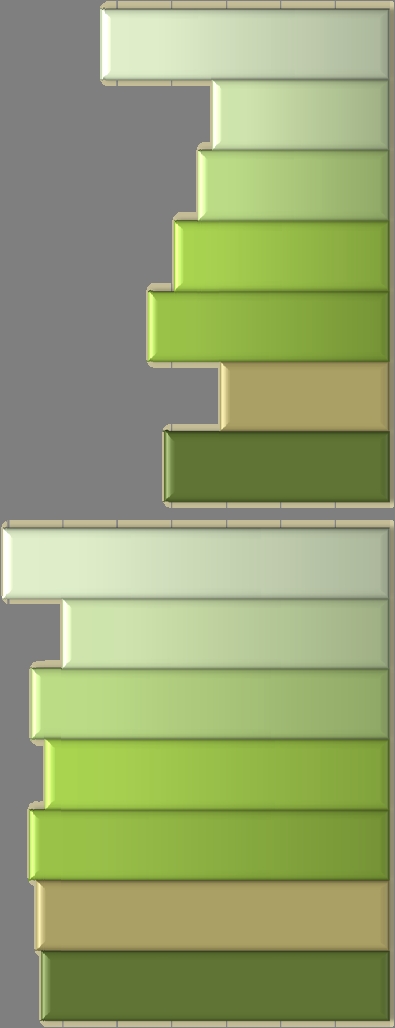
Fall 2010 to Spring 2011 - 84.5%
Fall 2010 to Fall 2011 – 55.2%
84%
55%
86%
60%
82%
49%
1
Sem
2
Sem
20%
30%
40%
50%
60%
70%
80%
90%
100%
Total
Students
Female
Male
84%
61%
85%
51%
86%
64%
83%
60%
86%
55%
80%
53%
91%
73%
1
Sem
2
Sem
20%
30%
40%
50%
60%
70%
80%
90%
100%
Asian
Black
Hispanic
White
Unknown
Two
or
more
races
Other
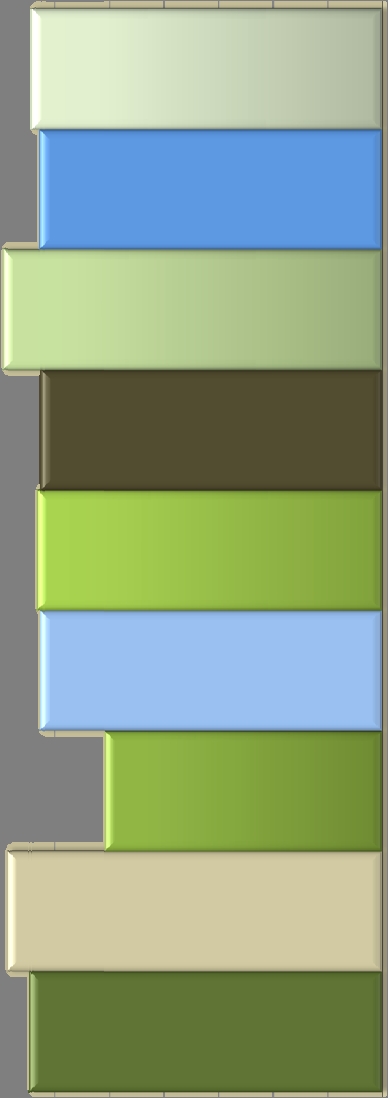
Allied
Health,
85%
Pre
‐
Nursing,
89%
Business,
71%
Business
Other,
83%
Computer
&
Electronics
Tech,
83%
Technology,
83%
Science
&
Math,
89%
General
Studies,
83%
Arts
&
Humanities,
84%
Fall
10
to
Spring
11
20%
30%
40%
50%
60%
70%
80%
90%
100%
Allied
Health
Pre
‐
Nursing
Business
Business
Other
Computer
&
Electronics
Tech
Technology
Science
&
Math
General
Studies
Arts
&
Humanities
Allied
Health,
58%
Pre
‐
Nursing,
59%
Business,
40%
Business
Other,
48%
Computer
&
Electronics
Tech,
45%
Technology,
52%
Science
&
Math,
60%
General
Studies,
54%
Arts
&
Humanities,
56%
Fall
10
to
Fall
11
20%
30%
40%
50%
60%
70%
80%
90%
100%
Allied
Health
Pre
‐
Nursing
Business
Business
Other
Computer
&
Electronics
Tech
Technology
Science
&
Math
General
Studies
Arts
&
Humanities
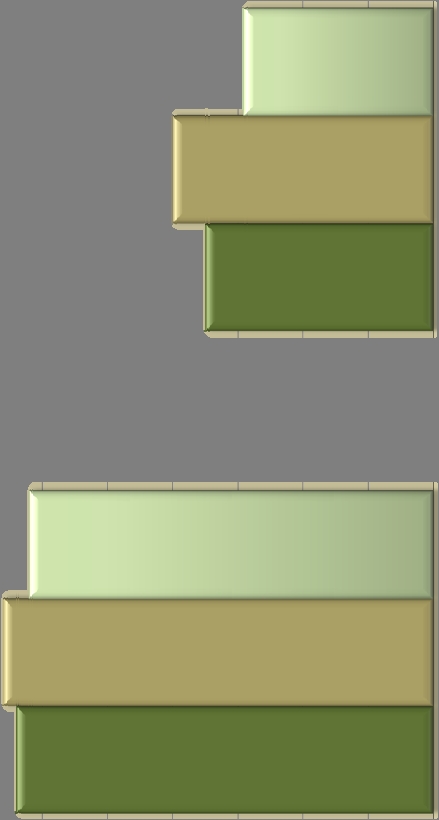
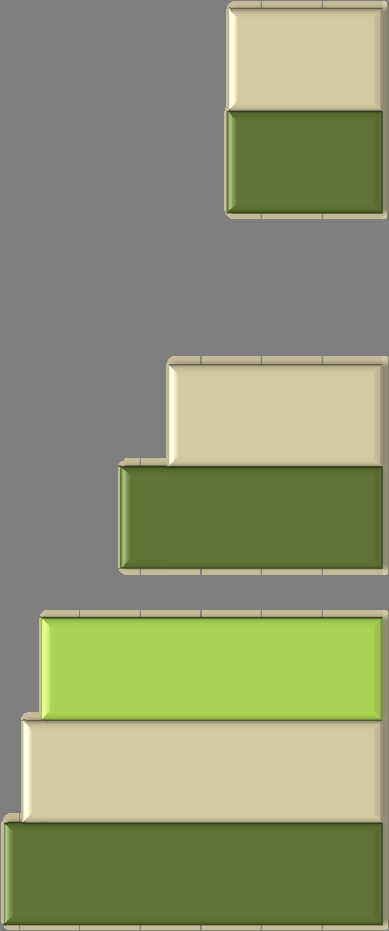
12.50
8.65
5.15
11.87
7.08
5.11
11.26
Hrs
Attempted Hrs
Earned Non
‐
dev
Hrs
Earned
0.00
2.00
4.00
6.00
8.00
10.00
12.00
14.00
Fall
2010
Spring
2011
Fall
2011
The average number of hours attempted decreases slightly in the second semester. The
average number of credits earned, however, drops significantly, making the second semester a
critical semester for students.
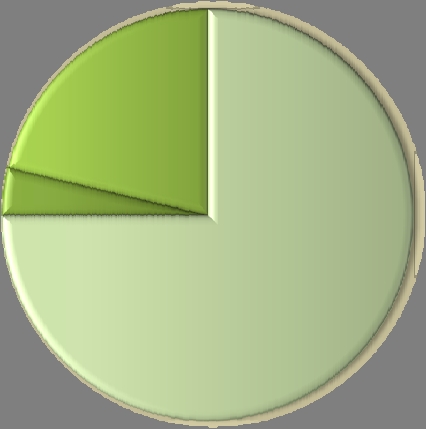
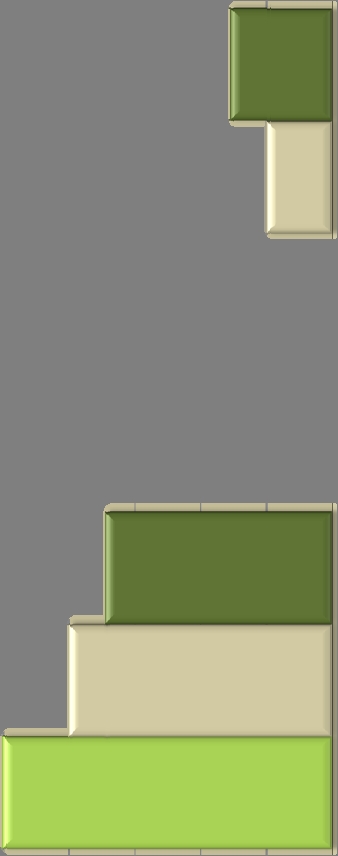
100%
0%
80%
20%
69%
31%
Full
time Part
time
0%
20%
40%
60%
80%
100%
120%
Fall
2010
Spring
2011
Fall
2011
Spring
2012
`
Fall 2010 – 485 FTFT Nursing majors
`
Fall 2011 - 288 are still enrolled
`
0 are taking Nursing classes
`
221 are still majoring in Nursing
`
9 changed to Practical Nursing
`
31 changed to other Allied Health Majors
`
27 changed to other DCC majors
`
4 students in Fall 2010 cohort have changed
their major to Nursing
`
Fall 2010 – 391 Allied Health majors
`
Fall 2011 - 228 are still enrolled
`
19 have been accepted into programs
`
206 are still majoring in Allied Health
`
1 changed to Practical Nursing
`
4 changed to Nursing Majors
`
17 changed to other DCC majors
`
Fall 2010 – 2,263
`
Fall 2011 – 1,250 still enrolled
`
1,047 (83%) are still taking developmental
classes
`
608 (49%) are enrolled in more than 1
developmental class
`
2,263 FTFT DS students
`
48 students graduating in 150% of normal
time = 2.1 GRS
`
57 students graduating in 150% of normal
time = 2.5 GRS
`
64 students graduating in 150% of normal
time = 2.8 GRS
`
70 students graduating in 150% of normal
time = 3.1 GRS