| |
A |
B |
C |
D |
E |
F |
G |
H |
| 1 |
|
|
|
|
|
|
|
|
| 2 |
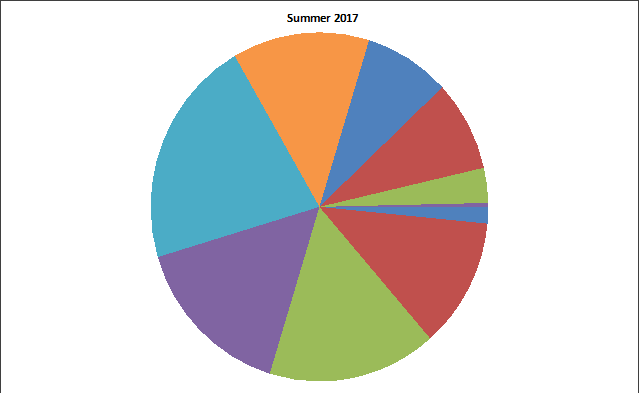
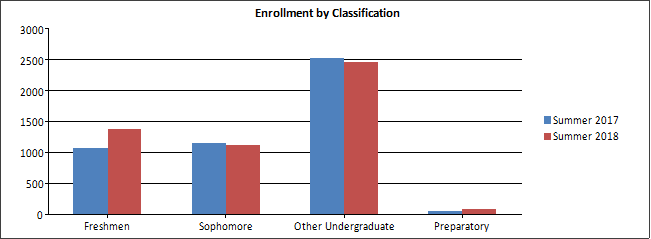
College-wide Enrollment by Program |
|
|
| 3 |
|
|
|
|
|
|
|
|
| 4 |
Programs of Study |
Summer |
|
Inc/Dec |
Percent Change |
|
|
| 5 |
|
2017 |
2018 |
|
|
|
|
|
| 6 |
English as a Second Language - DEG |
5 |
8 |
|
3 |
60% |
|
|
| 7 |
English as a Second Language - NODEG |
2 |
0 |
|
-2 |
-100% |
|
|
| 8 |
Non-degree Seeking, No Major |
908 |
886 |
|
-22 |
-2% |
|
|
| 9 |
Non-degree: Dual Enrollment |
54 |
81 |
|
27 |
50% |
|
|
| 10 |
Uncommitted Students |
969 |
975 |
|
6 |
1% |
|
|
| 11 |
Horticulture Technology |
4 |
0 |
|
-4 |
-100% |
|
|
| 12 |
Agriculture & Operations |
4 |
0 |
|
-4 |
-100% |
|
|
| 13 |
Performance & Media Arts |
0 |
0 |
|
0 |
na |
|
|
| 14 |
Communication, Journalism |
0 |
0 |
|
0 |
na |
|
|
| 15 |
Computer Information Technology |
78 |
67 |
|
-11 |
-14% |
|
|
| 16 |
Computer Network Technology |
45 |
32 |
|
-13 |
-29% |
|
|
| 17 |
Web Site Design |
6 |
5 |
|
-1 |
-17% |
|
|
| 18 |
Computer & Information Sciences |
129 |
104 |
|
-25 |
-19% |
|
|
| 19 |
Barber-Styling |
23 |
30 |
|
7 |
30% |
|
|
| 20 |
Cosmetology |
34 |
43 |
|
9 |
26% |
|
|
| 21 |
Culinary Arts |
43 |
40 |
|
-3 |
-7% |
|
|
| 22 |
Culinary Management |
2 |
0 |
|
-2 |
-100% |
|
|
| 23 |
Funeral Service Education |
31 |
29 |
|
-2 |
-6% |
|
|
| 24 |
Pastry Arts |
3 |
6 |
|
3 |
100% |
|
|
| 25 |
Personal & Culinary Services |
136 |
148 |
|
12 |
9% |
|
|
| 26 |
Teaching Grades 1-5 |
28 |
56 |
|
28 |
100% |
|
|
| 27 |
Education |
28 |
56 |
|
28 |
100% |
|
|
| 28 |
Architectural/Design Construction Technology |
15 |
20 |
|
5 |
33% |
|
|
| 29 |
Civil & Construction Applied Engineering Technology |
10 |
14 |
|
4 |
40% |
|
|
| 30 |
Computer Aided Design & Drafting |
16 |
20 |
|
4 |
25% |
|
|
| 31 |
Electrical-Electronics Engineering Technology |
48 |
40 |
|
-8 |
-17% |
|
|
| 32 |
Electronics Service Technology |
3 |
4 |
|
1 |
33% |
|
|
| 33 |
Engineering Technologies |
92 |
98 |
|
6 |
7% |
|
|
| 34 |
American Sign Language Interpreting |
26 |
18 |
|
-8 |
-31% |
|
|
| 35 |
Foreign Languages, Literatures |
26 |
18 |
|
-8 |
-31% |
|
|
| 36 |
Care & Development of Young Children |
57 |
85 |
|
28 |
49% |
|
|
| 37 |
Family & Consumer/Human Sciences |
57 |
85 |
|
28 |
49% |
|
|
| 38 |
Legal Secretary |
0 |
2 |
|
2 |
na |
|
|
| 39 |
Legal Professions & Studies |
0 |
2 |
|
2 |
na |
|
|
| 40 |
General Studies |
575 |
551 |
|
-24 |
-4% |
|
|
| 41 |
Transfer Degree - A.A. |
71 |
73 |
|
2 |
3% |
|
|
| 42 |
Transfer Degree - A.S. |
82 |
90 |
|
8 |
10% |
|
|
| 43 |
Liberal Arts & Sciences, General Studies |
728 |
714 |
|
-14 |
-2% |
|
|
| 44 |
Science Laboratory Technology |
17 |
12 |
|
-5 |
-29% |
|
|
| 45 |
Science Technologies/Technicians |
17 |
12 |
|
-5 |
-29% |
|
|
| 46 |
Criminal Justice |
97 |
117 |
|
20 |
21% |
|
|
| 47 |
Fire Science Technology |
23 |
23 |
|
0 |
0% |
|
|
| 48 |
Homeland Security, Law Enforcement, Firefighting |
120 |
140 |
|
20 |
17% |
|
|
| 49 |
Carpentry |
8 |
12 |
|
4 |
50% |
|
|
| 50 |
Electric Line Technician |
0 |
0 |
|
0 |
na |
|
|