Spring 2009
Final Enrollment Report
Published on August 2
5
, 2009
By
The Office of Institutional Research
Table of Contents
Page no.
Summary
Enrollment by Gender
1
Enrollment by Ethnicity
2
Enrollment by Age
4
Enrollment by Admission Status
6
Enrollment by Classification
8
Full-time/Part-time Status, Headcount, FTE, SCH
9
Enrollment by Award Sought
11
Enrollment by Division
12
Enrollment by Online Status
13
Enrollment by Online Status
13
Enrollment by Program, Full-time Status
14
Enrollment by Program, Part-time Status
15
Enrollment by Program
17
Enrollment by Program Ranked by Student Total
23
Enrollment by Parish
25
Top 50 "Feeder" High Schools of First Time Freshmen
27
Enrollment by Zip Code
28
SUMMARY
3
3
3
3
3
3
3
3
3
3
First-time Freshman student enrollment increased 27.6%, Readmit students increased
by 18.8% and Transfer students increased by 11.8%. While Continuing student
enrollment increased by 9.0% from Spring 2008.
Non-degree seekers increased by 21.4% and students seeking a technical diploma
increased by 19.6% from Spring 2008.
Our male enrollment increased by 13.7% while female enrollment increased by 10.1%
Asian enrollment increased by 31.4%, our Hispanic enrollment increased by 20.5%, our
Non-Resident Alien enrollment has increased by 21.2%, and our African American
enrollment by 9.3% in 1 year.
Enrollment increased 11.2% from Spring 2008 (13,176) to Spring 2009 (14,656).
Enrollment is down by 12.7% from Spring 2005 (pre-Katrina) to Spring 2009 (post-
The Northshore Site, created in Spring 2003, had the largest increased of 24.7% in the
last year.
Enrollment at the City Park campus increased by 8.4% since Spring 2008.
West Bank has grown increased by 15.5% since Spring 2008.
3
3
3
3
Pre-nursing had a significant increase of 7.3%, 195 students, while the number of
Students accepted into the Nursing program decreased by 3.9% from the last year.
Basic Education on the West Bank campus has increased by 34.5% since Spring 2008.
Enrollment of students residing in Orleans parish increased by 14.8%, St. Bernard
parish by 11.5% and Jefferson parish by 11.1%.
Business & Management, formerly named Management, had the largest increase of 320
students from last year. Teaching Grades 1-5, General Studies, General Science, and
English as a Second Language had significant increases in program enrollment.
Number % Number %
College Wide
Change Change Change Change
2005 2005 2008 2008
Enrollment Unduplicated
1
2005
2006 2007 2008 2009
to 2009 to 2009 to 2009 to 2009
City Park
11,441
5,926
7,059 8,339 9,036
-2,405 -21.0%
697 8.4%
West Bank
3,011
2,369 2,655 2,576 2,974
-37 -1.2%
398 15.5%
Charity School of Nursing
870
658 787 756 770
-100 -11.5%
14 1.9%
Northshore
1,465
1,048 1,272 1,505 1,876
411 28.1%
371 24.7%
Total
16,787
10,001 11,773 13,176 14,656
-2,131 -12.7%
1,480 11.2%
1
Students are counted once, on the campus that they are taking most of their classes.
Course Enrollment (Duplicated)
2
City Park
37,613
19,566 23,458 27,231 30,497
West Bank
9,849
7,848 8,847 8,751 9,389
Charity School of Nursing
1,355
1,022 1,168 1,098 1,215
Northshore
5,093
3,346 4,024 5,147 6,228
2
Students are counted for each class taken.
Unduplicated Campus Headcount
3
City Park
7,631
8,946 9,772
West Bank
3,332
3,349 3,809
Charity School of Nursing
781
757 790
Northshore
1,472
1,857 2,177
3
Students are counted once on each campus they are taking a class.
College Wide
2005 2005 2008 2008
Gender
2005 2006
2007 2008 2009
to 2009 to 2009 to 2009 to 2009
Female
11,773 7,126 8,200 9,029 9,941
-1,832 -15.6%
912 10.1%
M
l
5 014
2 875
3 573
4 147
4 715
299
6 0%
568
13 7%
Spring Enrollment History 2005-2009 by Campus
Each student is counted once college wide and assigned a
campus.
Spring Enrollment History 2005-2009 by Gender
Male
5,014 2,875 3,573 4,147 4,715
-299 -6.0%
568 13.7%
Total
16,787
10,001 11,773 13,176 14,656
-2,131 -12.7%
1,480 11.2%
Percentages
Female
70.1% 71.3% 69.7% 68.5% 67.8%
Male
29.9% 28.7% 30.3% 31.5% 32.2%
Number
% Number
%
Change
Change
Change
Change
City Park Campus
2005 2005 2008 2008
Gender
2005 2006
2007 2008 2009
to 2009 to 2009 to 2009 to 2009
Female
7,669 3,996 4,580 5,349 5,828
-1,841 -24.0%
479 9.0%
Male
3,772 1,930 2,479 2,990 3,208
-564 -15.0%
218 7.3%
Total
11,441
5,926
7,059 8,339 9,036
-2,405 -21.0%
697 8.4%
West Bank Campus
Female
2,292 1,779 2,000 1,946 2,121
-171 -7.5%
175 9.0%
Male
719 590 655 630 853
134 18.6%
223 35.4%
Total
3,011
2,369 2,655 2,576 2,974
-37 -1.2%
398 15.5%
Charity School of Nursing
Female
762 566 708 654 666
-96 -12.6%
12 1.8%
Male
108 92 79 102 104
-4 -3.7%
2
2.0%
Total
870
658 787 756 770
-100 -11.5%
14 1.9%
Northshore Site
Female
1,050 785 912 1,080 1,326
276 26.3%
246 22.8%
Male
415 263 360 425 550
135 32.5%
125 29.4%
Total
1,465
1,048 1,272 1,505 1,876
411 28.1%
371 24.7%
08/25/2009
1
Office of Institutional Research
Number
% Number
%
Change Change Change Change
College Wide
2005 2005 2008 2008
Ethnicity
2005 2006
2007 2008 2009
to 2009 to 2009 to 2009 to 2009
Asian/Pacific Islander
412 293 382 405 532
120 29.1%
127 31.4%
Native American
115 87 81 92 98
-17 -14.8%
6
6.5%
Black Non-Hispanic
7,267 3,427 4,294 5,002 5,465
-1,802 -24.8%
463 9.3%
Hispanic 808 605 667 810 976
168 20.8%
166 20.5%
White Non-Hispanic
6,218 4,542 5,080 5,325 5,872
-346 -5.6%
547 10.3%
Non Resident Alien
166 97 147 170 206
40 24.1%
36 21.2%
Did not indicate
1,801 950 1,122 1,372 1,507
-294 -16.3%
135 9.8%
Total
16,787 10,001 11,773 13,176 14,656
-2,131 -12.7%
1,480 11.2%
Percentages
Asian/Pacific Islander
2% 3% 3% 3% 4%
Native American
1% 1% 1% 1% 1%
Black Non-Hispanic
43% 34% 36% 38% 37%
Hispanic 5% 6% 6% 6% 7%
White Non-Hispanic
37% 45% 43% 40% 40%
Non Resident Alien
1% 1% 1% 1% 1%
Did not indicate
11% 9% 10% 10% 10%
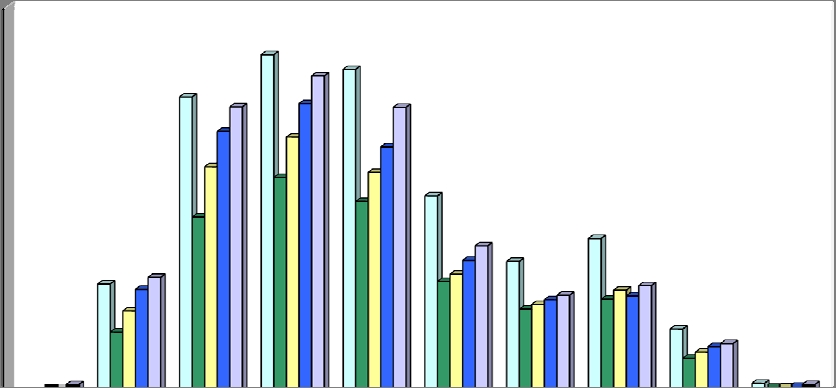
Spring Enrollment History 2005-2009 by Ethnicity
7,000
8,000
0
1,000
2,000
3,000
4,000
5,000
6,000
7,000
8,000
Asian/Pacific
Islander
Native
American
Black Non-
Hispanic
Hispanic White Non-
Hispanic
Non Resident
Alien
Did not
indicate
2005
2006
2007
2008
2009
08/25/2009
2
Office of Institutional Research
Number
% Number
%
Change Change Change Change
City Park Campus
2005 2005 2008 2008
2005 2006
2007 2008 2009
to 2009 to 2009 to 2009 to 2009
Asian/Pacific Islander
300 181 235 285 371
71 23.7%
86 30.2%
Native American
64 45 47 52 56
-8 -12.5%
4
7.7%
Black Non-Hispanic
5,247 1,935 2,525 3,154 3,320
-1,927 -36.7%
166 5.3%
Hispanic
585 413 464 603 710
125 21.4%
107 17.7%
White Non-Hispanic
3,864 2,660 2,943 3,245 3,478
-386 -10.0%
233 7.2%
Non Resident Alien
159 94 132 162 191
32 20.1%
29 17.9%
Did not indicate
1,222 598 713 838 910
-312 -25.5%
72 8.6%
Total
11,441 5,926 7,059 8,339 9,036
-2,405 -21.0%
697 8.4%
Asian/Pacific Islander
87 95 133 98 126
39 44.8%
28 28.6%
Native American
33 28 20 22 21
-12 -36.4%
-1 -4.5%
Black Non-Hispanic
1,549 1,100 1,263 1,290 1,547
-2 -0.1%
257 19.9%
Hispanic
146 126 125 105 159
13 8.9%
54 51.4%
White Non-Hispanic
896 797 853 742 795
-101 -11.3%
53 7.1%
Non Resident Alien
2 3 10 3 4
2 100.0%
1 33.3%
Did not indicate
298 220 251 316 322
24 8.1%
6 1.9%
Total
3,011 2,369 2,655 2,576 2,974
-37 -1.2%
398 15.5%
Charity School of Nursing
Asian/Pacific Islander
18 12 6 10 15
-3 -16.7%
5 50.0%
Native American
8 6 4 6 6
-2 -25.0%
0
0.0%
Black Non-Hispanic
214
171
231
216
202
-12
-5.6%
-14
-6.5%
West Bank Campus
Spring Enrollment History 2005-2009 Ethnicity by Campus
Black
Non-Hispanic
214
171
231
216
202
-12
-5.6%
-14
-6.5%
Hispanic 37 38 40 43 47
10 27.0%
4 9.3%
White Non-Hispanic
490 374 433 394 428
-62 -12.7%
34 8.6%
Non Resident Alien
4 0 4 4 9
5 125.0%
5 125.0%
Did not indicate
99 57 69 83 63
-36 -36.4%
-20 -24.1%
Total
870 658 787 756 770
-100 -11.5%
14 1.9%
Northshore Site
Asian/Pacific Islander
7 5 8 12 20
13 185.7%
8 66.7%
Native American
10 8 10 12 15
5 50.0%
3 25.0%
Black Non-Hispanic
257 221 275 342 396
139 54.1%
54 15.8%
Hispanic
40 28 38 59 60
20 50.0%
1 1.7%
White Non-Hispanic
968 711 851 944 1171
203 21.0%
227 24.0%
Non Resident Alien
1 0 1 1 2
1 100.0%
1 100.0%
Did not indicate
182 75 89 135 212
30 16.5%
77 57.0%
Total
1,465 1,048 1,272 1,505 1,876
411 28.1%
371 24.7%
08/25/2009
3
Office of Institutional Research
Number
% Number
%
Change Change Change Change
College Wide
2005 2005 2008 2008
2005 2006
2007 2008 2009
to 2009 to 2009 to 2009 to 2009
Less Than 18
24 10 34 28
71
47 195.8%
43 153.6%
18-19
1,119 619 837 1,062
1187
68 6.1%
125 11.8%
20-21
3,067 1,816 2,339 2,708
2963
-104 -3.4%
255 9.4%
22-24 3,507 2,228 2,648 2,996
3286
-221 -6.3%
290 9.7%
25-29 3,353 1,978 2,281 2,546
2959
-394 -11.8%
413 16.2%
30-34 2,036 1,146 1,220 1,365
1517
-519 -25.5%
152 11.1%
35-39 1,354 857 905 955
1002
-352 -26.0%
47 4.9%
40-49
1,592 960 1,053 995
1101
-491 -30.8%
106 10.7%
50-64 650 345 409 467
498
-152 -23.4%
31 6.6%
65 and Over
85 42 47 54
72
-13 -15.3%
18 33.3%
Total
16,787 10,001 11,773 13,176 14,656
-2,131 -12.7%
1,480 11.2%
Average Age
28 28 28 28 28
Percentages
Less Than 18
0% 0% 0% 0% 0%
18-19
7% 6% 7% 8% 8%
20-21
18% 18% 20% 21% 20%
22-24
21% 22% 22% 23% 22%
25-29
20% 20% 19% 19% 20%
30-34
12% 11% 10% 10% 10%
35-39
8% 9% 8% 7% 7%
40-49
9% 10% 9% 8% 8%
50-64
4% 3% 3% 4% 3%
65 and Over
1% 0% 0% 0% 0%
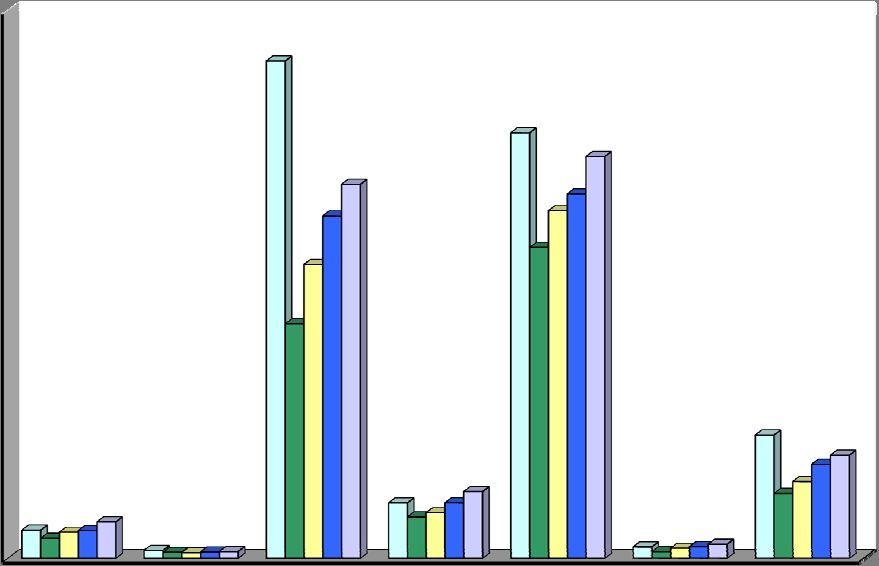
Spring Enrollment History 2005-2009 by Age
0
500
1,000
1,500
2,000
2,500
3,000
3,500
4,000
Less
Than 18
18-19 20-21 22-24 25-29 30-34 35-39 40-49 50-64 65 and
Over
2005
2006
2007
2008
2009
08/25/2009
4
Office of Institutional Research
Number
% Number
%
Change Change Change Change
City Park Campus
2005 2005 2008 2008
2005 2006
2007 2008 2009
to 2009 to 2009 to 2009 to 2009
Less Than 18
17 6 16 18 57
40 235.3%
39 216.7%
18-19
822 309 479 670 781
-41 -5.0%
111 16.6%
20-21
2,183 1,077 1,440 1,682 1,819
-364 -16.7%
137 8.1%
22-24
2,456 1,409 1,698 2,010 2,137
-319 -13.0%
127 6.3%
25-29
2,289 1,180 1,371 1,627 1,846
-443 -19.4%
219 13.5%
30-34
1,300 684 686 843 874
-426 -32.8%
31 3.7%
35-39
844 481 498 552 569
-275 -32.6%
17 3.1%
40-49
1,031 532 601 606 612
-419 -40.6%
6
1.0%
50-64
439 229 247 303
303
-136 -31.0%
0
0.0%
65 and Over
60 19 23 28 38
-22 -36.7%
10 35.7%
Total
11,441 5,926 7,059 8,339 9,036
-2,405 -21.0%
697 8.4%
West Bank Campus
Less Than 18
5 4 18 7 13
8 160.0%
6 85.7%
18-19
197 218 250 260 244
47 23.9%
-16 -6.2%
20-21
565 493 542 606 655
90 15.9%
49 8.1%
22-24
612 485 544 503 635
23 3.8%
132 26.2%
25-29
533 416 493 454 537
4 0.8%
83 18.3%
30-34
391 224 252 246 323
-68 -17.4%
77 31.3%
35-39
255 184 177 187 201
-54 -21.2%
14 7.5%
40-49
292 243 245 189 228
-64 -21.9%
39 20.6%
50-64
139 80 111 100
108
-31 -22.3%
8
8.0%
65 and Over
22 22 23 24 30
8 36.4%
6 25.0%
Total
3,011 2,369 2,655 2,576 2,974
-37 -1.2%
398 15.5%
Spring Enrollment History 2005-2009 by Age by Campus
Charity School of Nursing
Less Than 18
0 0 0 0 0
0 0.0%
0 0.0%
18-19
0 0 0 0 0
0 0.0%
0 0.0%
20-21
17 7 8 13 13
-4 -23.5%
0
0.0%
22-24
181 115 155 162 156
-25 -13.8%
-6 -3.7%
25-29
256 193 214 224 230
-26 -10.2%
6
2.7%
30-34
183 138 155 144 138
-45 -24.6%
-6 -4.2%
35-39
109 106 138 108 98
-11 -10.1%
-10 -9.3%
40-49
104 83 101 90 103
-1 -1.0%
13 14.4%
50-64
20 16 16 15 32
12 60.0%
17 113.3%
65 and Over
0 0 0 0 0
0 0.0%
0 0.0%
Total
870 658 787 756 770
-100 -11.5%
14 1.9%
Northshore Site
Less Than 18
2 0 0 3 1
-1 -50.0%
-2 -66.7%
18-19
100 92 108 132 162
62 62.0%
30 22.7%
20-21
302 239 349 407 476
174 57.6%
69 17.0%
22-24
258 219 251 321 358
100 38.8%
37 11.5%
25-29
275 189 203 241 346
71 25.8%
105 43.6%
30-34
162 100 127 132 182
20 12.3%
50 37.9%
35-39
146 86 92 108 134
-12 -8.2%
26 24.1%
40-49
165 102 106 110 158
-7 -4.2%
48 43.6%
50-64
52 20 35 49 55
3 5.8%
6 12.2%
65 and Over
3 1 1 2 4
1 33.3%
2 100.0%
Total
1,465 1,048 1,272 1,505 1,876
411 28.1%
371 24.7%
08/25/2009
5
Office of Institutional Research
Number
% Number
%
College Wide
Change Change Change Change
2005 2005 2008 2008
2005 2006
2007 2008 2009
to 2009 to 2009 to 2009 to 2009
First-Time Freshmen*
1,432 1,535 1,056 1,098 1,401
-31 -2.2%
303 27.6%
Transfer Student
1,243 518 1,076 1,140 1,275
32 2.6%
135 11.8%
Continuing Students
12,323 7,322 8,223 9,458 10,312
-2,011 -16.3%
854 9.0%
Readmitted Students
1,518 540 1,251 1,097 1,303
-215 -14.2%
206 18.8%
Exchange Students
219 86 167 184 242
23 10.5%
58 31.5%
Other Students
0 0 199 123
0 0%
-76 -38.2%
Total
16,787 10,001 11,773 13,176 14,656
-2,131 -12.7%
1,480 11.2%
Percentages
First-Time Freshmen
9% 15% 9% 8% 10%
Transfer Student
7% 5% 9% 9% 9%
Continuing Students
73% 73% 70% 72% 70%
Readmitted Students
9% 5% 11% 8% 9%
Exchange Students
1% 1% 1% 1% 2%
Other Students
0% 0% 0% 2% 1%
* 1,043 were First-time Freshman in Fall 2005 who returned in Spring 2006; 483 are new first time frehman for Spring 2006
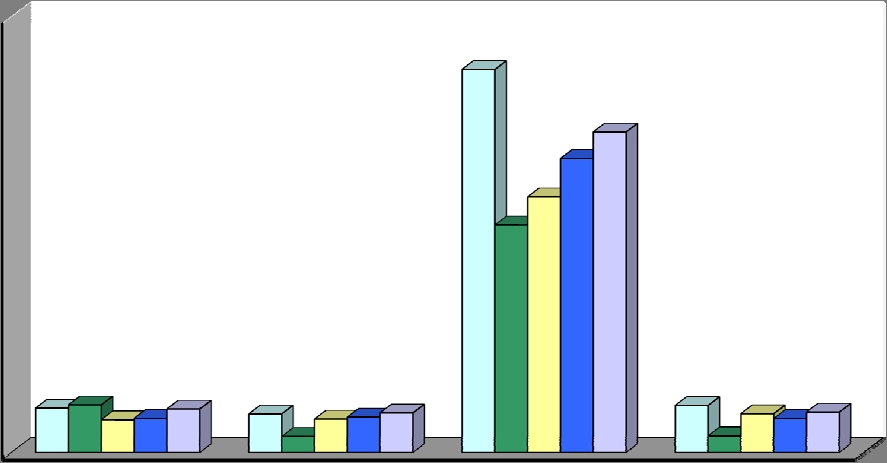
Spring Enrollment History 2005-2009 by Admission Status
14,000
S
pring Enrollment History 1997-2000
0
2,000
4,000
6,000
8,000
10,000
12,000
14,000
First-Time Freshmen* Transfer Student Continuing Students Readmitted Students
2005
2006
2007
2008
2009
08/25/2009
6
Office of Institutional Research
Number
% Number
%
Change Change Change Change
City Park Campus
2005 2005 2008 2008
2005 2006
2007 2008 2009
to 2009 to 2009 to 2009 to 2009
First-Time Freshmen
941 775 623 659 910
-31 -3.3%
251 38.1%
Transfer Student
863 302 697 725 859
-4 -0.5%
134 18.5%
Continuing Students
8,373 4,489 4,841 5,931 6,271
-2,102 -25.1%
340 5.7%
Readmitted Students
1,040 312 786 676 763
-277 -26.6%
87 12.9%
Exchange Students
172 48 112 149 186
14 8.1%
37 24.8%
Other Students
52 0 0 199 47
-5 -9.6%
-152 -76.4%
Total
11,441 5,926 7,059 8,339 9,036
-2,405 -21.0%
697 8.4%
First-Time Freshmen
304 482 260 232 264
-40 -13.2%
32 13.8%
Transfer Student
200 143 208 170 180
-20 -10.0%
10 5.9%
Continuing Students
2,190 1,535 1,842 1,884 2,076
-114 -5.2%
192 10.2%
Readmitted Students
288 174 293 258 331
43 14.9%
73 28.3%
Exchange Students
29 35 52 32 47
18 62.1%
15 46.9%
Other Students
0 0 0 0 76
76 0.0%
76 0.0%
Total
3,011 2,369 2,655 2,576 2,974
-37 -1.2%
398 15.5%
Charity School of Nursing
First-Time Freshmen
0 0 1 0 0
0 0.0%
0 0.0%
Transfer Student
23
0
15
50
5
-18
-78.3%
-45
-90.0%
West Bank Campus
Spring Enrollment History 2005-2009 by Admission Status by Campus
Transfer
Student
23
0
15
50
5
-18
-78.3%
-45
-90.0%
Continuing Students
772 641 706 668 716
-56 -7.3%
48 7.2%
Readmitted Students
75 16 64 38 49
-26 -34.7%
11 28.9%
Exchange Students
0 1 1 0 0
0 0.0%
0 0.0%
Other Students
0 0 0 0 0
0 0.0%
0 0.0%
Total
870 658 787 756 770
-100 -11.5%
14 1.9%
Northshore Site
First-Time Freshmen
187 278 172 207 227
40 21.4%
20 9.7%
Transfer Student
157 73 156 195 231
74 47.1%
36 18.5%
Continuing Students
988 657 834 975 1,249
261 26.4%
274 28.1%
Readmitted Students
115 38 108 125 160
45 39.1%
35 28.0%
Exchange Students
18 2 2 3 9
-9 -50.0%
6 200.0%
Other Students
0 0 0 0 0
0 0.0%
0 0.0%
Total
1,465 1,048 1,272 1,505 1,876
411 28.1%
371 24.7%
08/25/2009
7
Office of Institutional Research
Number
% Number
%
College Wide
Change Change Change Change
2005 2005 2008 2008
2005 2006
2007 2008 2009
to 2009 to 2009 to 2009 to 2009
Freshmen
8,564 5,130 6,042 6,736 7,568
-996 -11.6%
832 12.4%
Sophomore
4,024 2,351 2,684 3,066 3,400
-624 -15.5%
334 10.9%
Other Undergraduates
4,035 2,455 2,905 3,209 3,473
-562 -13.9%
264 8.2%
Preparatory
164 65 142 165 215
51 31.1%
50 30.3%
Total
16,787 10,001 11,773 13,176 14,656
-2,131 -12.7%
1,480 11.2%
Percentages
Freshmen
51% 51% 51% 51% 52%
Sophomore
24% 24% 23% 23% 23%
Other Undergraduates
24% 25% 25% 24% 24%
Preparatory
1% 1% 1% 1% 1%
Number % Number %
Change Change Change Change
City Park Campus
2005 2005 2008 2008
2005 2006
2007 2008 2009
to 2009 to 2009 to 2009 to 2009
Freshmen
5,940 2,957 3,612 4,257 4,639
-1,301 -21.9%
382 9.0%
Sophomore
2,793 1,486 1,698 1,999 2,158
-635 -22.7%
159 8.0%
Other Undergraduates
2,573 1,443 1,654 1,948 2,067
-506 -19.7%
119 6.1%
Preparatory
135 40 95 135 172
37 27.4%
37 27.4%
Total
11,441 5,926 7,059 8,339 9,036
-2,405 -21.0%
697 8.4%
Spring Enrollment History 2005-2009 Classification by Campus
Spring Enrollment History 2005-2009 by Classification
West Bank Campus
Freshmen
1,631 1,400 1,487 1,414 1,694
63 3.9%
280 19.8%
Sophomore
788 560 643 660 712
-76 -9.6%
52 7.9%
Other Undergraduates
570 387 481 475 533
-37 -6.5%
58 12.2%
Preparatory
22 22 44 27 35
13 59.1%
8 29.6%
Total
3,011 2,369 2,655 2,576 2,974
-37 -1.2%
398 15.5%
Charity School of Nursing
Freshmen
7 2 8 1 0
-7 -100.0%
-1 -100.0%
Sophomore
118 114 119 110 118
0 0.0%
8 7.3%
Other Undergraduates
745 541 659 645 652
-93 -12.5%
7
1.1%
Preparatory
0 1 1 0 0
0 0.0%
0 0.0%
Total
870 658 787 756 770
-100 -11.5%
14 1.9%
Northshore Site
Freshmen
986 771 935 1,064 1,235
249 25.3%
171 16.1%
Sophomore
325 191 224 297 412
87 26.8%
115 38.7%
Other Undergraduates
147 84 111 141 221
74 50.3%
80 56.7%
Preparatory
7 2 2 3 8
1 14.3%
5 166.7%
Total
1,465 1,048 1,272 1,505 1,876
411 28.1%
371 24.7%
08/25/2009
8
Office of Institutional Research
Number
% Number
%
College Wide
Change Change Change Change
2005 2005 2008 2008
2005 2006
2007 2008 2009
to 2009 to 2009 to 2009 to 2009
Full Time
7,108 4,134 4,951 5,644 6,497
-611 -8.6%
853 15.1%
Part Time
9,679 5,867 6,822 7,532 8,159
-1,520 -15.7%
627 8.3%
Headcount
16,787 10,001 11,773 13,176 14,656
-2,131 -12.7%
1,480 11.2%
SCH
157,847 93,580 110,912 124,687 139,136
-18,711 -11.9%
14,449 11.6%
FTE* Funding (based on 15 SCH)
10,523 6,239 7,394 8,312 9,276
-1,247 -11.9%
963 11.6%
FTE Other (based on 12 SCH)
13,154 7,798 9,243 10,391 11,595
-1,559 -11.9%
1,204 11.6%
Percentages
Full Time
42% 41% 42% 43% 44%
Part Time
58% 59% 58% 57% 56%
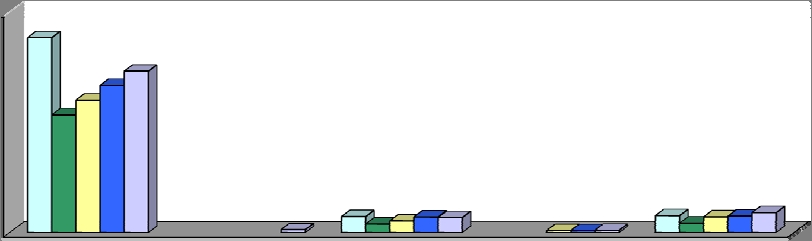
Spring Enrollment History 2005-2009 by
Full/Part Time Status, Headcount, FTE, SCH
2 000
4,000
6,000
8,000
10,000
12,000
14,000
16,000
18,000
* FTE is calculated by dividing schedule credit hours by 15.
0
2,000
4,000
6,000
8,000
10,000
12,000
14,000
16,000
18,000
Full Time Part Time Headcount FTE* Funding
(based on 15
SCH)
FTE Other
(based on 12
SCH)
2005
2006
2007
2008
2009
0
20,000
40,000
60,000
80,000
100,000
120,000
140,000
160,000
180,000
Scheduled Credit Hours
2005
2006
2007
2008
2009
08/25/2009
9
Office of Institutional Research
Number
% Number
%
Change Change Change Change
City Park Campus
2005 2005 2008 2008
2005 2006
2007 2008 2009
to 2009 to 2009 to 2009 to 2009
Full Time
5,038 2,565 3,118 3,735 4,265
-773 -15.3%
530 14.2%
Part Time
6,403 3,361 3,941 4,604 4,771
-1,632 -25.5%
167 3.6%
Headcount
11,441 5,926 7,059 8,339 9,036
-2,405 -21.0%
697 8.4%
SCH
108,504 56,407 67,478 79,360 88,032
-20,472 -18.9%
8,672 10.9%
FTE* Funding (based on 15 SCH)
7,234 3,760 4,499 5,291 5,869
-1,365 -18.9%
578 10.9%
FTE Other (based on 12 SCH)
9,042 4,701 5,623 6,613 7,336
-1,706 -18.9%
723 10.9%
West Bank Campus
Full Time
1,240 970 1,101 1,099 1,164
-76 -6.1%
65 5.9%
Part Time
1,771 1,399 1,554 1,477 1,810
39 2.2%
333 22.5%
Headcount
3,011 2,369 2,655 2,576 2,974
-37 -1.2%
398 15.5%
SCH
27,399 21,326 23,908 23,806 25,413
-1,986 -7.2%
1,607 6.8%
FTE* Funding (based on 15 SCH)
1,827 1,422 1,594 1,587 1,694
-132 -7.2%
107 6.8%
FTE Other (based on 12 SCH)
2,283 1,777 1,992 1,984 2,118
-166 -7.2%
134 6.8%
Charity School of Nursing
Full Time
271 200 235 195 214
-57 -21.0%
19 9.7%
Part Time
599
458
552
561
556
43
7 2%
5
0 9%
Spring Enrollment History 2005-2009
by Full/Part Time Status, Headcount, FTE, SCH by Campus
P
art Time
599
458
552
561
556
-43
-7.2%
-5
-0.9%
Headcount
870 658 787 756 770
-100 -11.5%
14 1.9%
SCH
8,988 6,587 8,072 7,613 8,003
-985 -11.0%
390 5.1%
FTE* Funding (based on 15 SCH)
599 439 538 508 534
-66 -11.0%
26 5.1%
FTE Other (based on 12 SCH)
749 549 673 634 667
-82 -11.0%
33 5.1%
Northshore Site
Full Time
559 399 497 615 854
295 52.8%
239 38.9%
Part Time
906 649 775 890 1,022
116 12.8%
132 14.8%
Headcount
1,465 1,048 1,272 1,505 1,876
411 28.1%
371 24.7%
SCH
12,956 9,260 11,454 13,908 17,688
4,732 36.5%
3,780 27.2%
FTE* Funding (based on 15 SCH)
864 617 764 927 1,179
315 36.5%
252 27.2%
FTE Other (based on 12 SCH)
1,080 772 955 1,159 1,474
394 36.5%
315 27.2%
08/25/2009
10
Office of Institutional Research
Number
% Number
%
College Wide
Change Change Change Change
2005 2005 2008 2008
2005 2006
2007 2008 2009
to 2009 to 2009 to 2009 to 2009
Associate - 2 yr
14,176 8,565 9,635 10,706 11,736
-2,440 -17.2%
1,030 9.6%
Post-Associate Cert
211
N/A N/A
N/A
N/A
Certificate - 1 yr
1,164 629 847 1,137 1,093
-71 -6.1%
-44 -3.9%
Diploma
145 138 165
N/A N/A
27 19.6%
Non-degree seeking
1,234 690 1,146 1,195 1,451
217 17.6%
256 21.4%
Total
16,787 10,001 11,773 13,176 14,656
-2,131 -12.7%
1,480 11.2%
Number
% Number
%
Change Change Change Change
City Park Campus
2005 2005 2008 2008
Spring Enrollment History 2005-2009 by Award Sought
Spring Enrollment History 1997-2000
0
2,000
4,000
6,000
8,000
10,000
12,000
14,000
16,000
Associate - 2 yr Post-Associate Cert Certificate - 1 yr
Diploma Non-degree seeking
2005
2006
2007
2008
2009
City Park Campus
2005
2005
2008
2008
2005 2006
2007 2008 2009
to 2009 to 2009 to 2009 to 2009
Associate - 2 yr
9,461 4,956 5,569 6,457 7,108
-2,353 -24.9%
651 10.1%
Post-Associate Cert
146
N/A N/A
N/A
N/A
Certificate - 1 yr
889 435 620 826 762
-127 -14.3%
-64 -7.7%
Diploma
94 31 42 54 51
-43 -45.7%
-3 -5.6%
Non-degree seeking
997 504 828 1,002 969
-28 -2.8%
-33 -3.3%
Total
11,441 5,926 7,059 8,339 9,036
-2,405 -21.0%
697 8.4%
West Bank Campus
Associate - 2 yr
2,606 2,033 2,192 2,193 2,280
-326 -12.5%
87 4.0%
Post-Associate Cert
34
N/A N/A
N/A
N/A
Certificate - 1 yr
188 141 175 188 175
-13 -6.9%
-13 -6.9%
Diploma
44 33 41 33 35
-9 -20.5%
2
6.1%
Non-degree seeking
173 162 247 162 450
277 160.1%
288 177.8%
Total
3,011 2,369 2,655 2,576 2,974
-37 -1.2%
398 15.5%
Charity School of Nursing
Associate - 2 yr
815 619 739 713 702
-113 -13.9%
-11 -1.5%
Post-Associate Cert
0
N/A N/A
N/A
N/A
Certificate - 1 yr
0 0 0 0 0
0 0.0%
0 0.0%
Diploma
54 39 48 42 68
14 25.9%
26 61.9%
Non-degree seeking
1 0 0 1 0
-1 -100.0%
-1 -100.0%
Total
870 658 787 756 770
-100 -11.5%
14 1.9%
Northshore Site
Associate - 2 yr
1,294 957 1,135 1,343 1,646
352 27.2%
303 22.6%
Post-Associate Cert
31
N/A N/A
N/A
N/A
Certificate - 1 yr
87 53 52 123 156
69 79.3%
33 26.8%
Diploma
21 14 14 9 11
-10 -47.6%
2 22.2%
Non-degree seeking
63 24 71 30 32
-31 -49.2%
2
6.7%
Total
1,465 1,048 1,272 1,505 1,876
411 28.1%
371 24.7%
0
2,000
4,000
6,000
8,000
10,000
12,000
14,000
16,000
Associate - 2 yr Post-Associate Cert Certificate - 1 yr
Diploma Non-degree seeking
2005
2006
2007
2008
2009
08/25/2009
11
Office of Institutional Research
Number
% Number
%
Change Change Change Change
2005 2005 2008 2008
2005 2006
2007 2008 2009
to 2009 to 2009 to 2009 to 2009
Allied Health
2,571
1,316 1,419 1,346 1,349
-1,222 -47.5%
3
0.2%
Basic Education-CPC
1,951
1,067 1,187 1,955 1,934
-17 -0.9%
-21 -1.1%
Business and Technology
2,362
1,098 1,545 1,837 2,168
-194 -8.2%
331 18.0%
Liberal Arts
2,526
1,324 1,655 1,754 2,008
-518 -20.5%
254 14.5%
Science & Math
1,901
1,121 1,252 1,447 1,576
-325 -17.1%
129 8.9%
Workforce Development
130
0 1
0
1
-129 -99.2%
1
0.0%
Campus Total
11,441 5,926 7,059 8,339 9,036
-2,405 -21.0%
697 8.4%
Basic Education-WBC
1,901 1,271 1,505 699 940
-961 -50.6%
241 34.5%
Business, Technology & Math
462 399 482 483 562
100 21.6%
79 16.4%
Liberal Arts & Sciences
648 699 668 1,394 1,472
824 127.2%
78 5.6%
Campus Total
3,011 2,369 2,655 2,576 2,974
-37 -1.2%
398 15.5%
Nursing
788
870 658 787 770
-18 -2.3%
-17 -2.2%
Basic Education-NS
395 311 329 476 448
53 13.4%
-28 -5.9%
Covington
359 360 464 499 832
473 131.8%
333 66.7%
Slidell
711 377 479 530 596
-115 -16.2%
66 12.5%
Site Total
1,465 1,048 1,272 1,505 1,876
411 28.1%
371 24.7%
College Total
16,705 10,213 11,644 13,207 14,656
-2,049 -12.3%
1,449 11.0%
Spring Enrollment History 2005-2009 by Division
Northshore Site
West Bank Campus
City Park Campus
9%
13%
15%
14%
11%
0%
6%
4%
10%
5%
3%
6%
4%
Spring 2009
Allied Health
Basic Education-CPC
Business and Technology
Liberal Arts
Science & Math
Workforce Development
Basic Education-WBC
Business, Technology & Math
Liberal Arts & Sciences
Nursing
Basic Education-NS
Covington
Slidell
08/25/2009
12
Office of Institutional Research
Number
% Number
%
Change Change Change Change
College Wide
2005 2005 2008 2008
2005
2006 2007 2008 2009
to 2009 to 2009 to 2009 to 2009
No. of students taking a web class
2,471 2,837 3,199 3,509
310 9.7%
Students taking only web classes
879 743 748 769
21 2.8%
Average no. of web courses taken
1.8 1.8 1.7
0 -1.5%
Students in only F2F classes
7,531 8,936 9,977 11,147
1,170 11.7%
Total
10,002 11,773 13,176 14,656
1,480 11.2%
Note: F2F = Face to Face
Percentages
Students taking a web class
24.1% 24.3% 23.9%
Students taking only web classes
6.3% 5.7% 5.2%
Average no. of web courses taken
Students in only F2F classes
75.9% 75.7% 76.1%
Note: Percentages will not add up to 100%.
City Park
2005 2005 2008 2008
2005
2006 2007 2008 2009
to 2009 to 2009 to 2009 to 2009
No. of students taking a web class
1,825 1,807 2,195 2,187
-8 -0.4%
Students taking only web classes
767 523 582 532
-50 -8.6%
Average no. of web courses taken
2.0 1.9 1.8 1.8
0 -2.5%
Students in only F2F classes
4,093 5,252 6,144 6,849
705 11.5%
Spring Enrollment History 2005-2009 by Online Status
y
,
,
,
,
Total
5,926 7,059 8,339 9,036
697 8.4%
West Bank
2005 2005 2008 2008
2005
2006 2007 2008 2009
to 2009 to 2009 to 2009 to 2009
No. of students taking a web class
447 722 666 783
117 17.6%
Students taking only web classes
101 204 151 170
19 12.6%
Average no. of web courses taken
1.7 1.8 1.7 1.7
0 -2.1%
Students in only F2F classes
1,920 1,933 1,910 2,191
281 14.7%
Total
2,369 2,655 2,576 2,974
398 15.5%
Charity School of Nursing
2005 2005 2008 2008
2005
2006 2007 2008 2009
to 2009 to 2009 to 2009 to 2009
No. of students taking a web class
17 29 23 22
-1 -4.3%
Students taking only web classes
1 0 0 0
0 0.0%
Average no. of web courses taken
1.1 1.0 1.0 1.0
0 -4.1%
Students in only F2F classes
641 758 733 748
15 2.0%
Total
658 787 756 770
14 1.9%
Northshore site
2005 2005 2008 2008
2005
2006 2007 2008 2009
to 2009 to 2009 to 2009 to 2009
No of students taking a web class
180 279 315 517
202 64.1%
Students taking only web classes
9 16 15 67
52 346.7%
Average no. of web courses taken
1.3 1.4 1.3 1.6
0 17.3%
Students in only F2F classes
868 993 1,190 1,359
169 14.2%
Total
1,048 1,272 1,505 1,876
371 24.7%
08/25/2009
13
Office of Institutional Research
Number % Number %
College Wide
Change Change Change Change
2005 2005 2008 2008
2005
2006 2007 2008 2009
to 2009 to 2009 to 2009 to 2009
Accounting
258
105 169 183
214
-44 -17.1%
31 16.9%
Administrative Office Tech
57
33 37 43
37
-20 -35.1%
-6 -14.0%
Air Conditioning & Refrigeration
0
0
0 0
0
0 0.0%
0 0.0%
American Sign Language Studies
7
5
8 12
9
2 28.6%
-3 -25.0%
Business Administration
543
322 488 555
558
15 2.8%
3 0.5%
Business Training
0
0 0.0%
0 0.0%
Care & Development of Young Children
322
179 157 138 152
-170 -52.8%
14 10.1%
Carpentry
0
1 0
0
0
0 0.0%
0 0.0%
Certified Nurse Assistant
0
0 0
0
0
0 0.0%
0 0.0%
CET-Architectural Engineering
72
52 46 58 60
-12 -16.7%
2
3.4%
CET-Civil Construction Technology
17
7 17
18
22
5 29.4%
4 22.2%
CET-Construction Management
28
10 27 25 33
5 17.9%
8 32.0%
Computer Aided Drafting & Design -CADD
44
18 32 46 64
20 45.5%
18 39.1%
Computer Information Technology
178
84 100 102 105
-73 -41.0%
3
2.9%
Computer Network Technology
114
66 45 49 63
-51 -44.7%
14 28.6%
Computer Repair (Certificate)
17
6 10
14
14
-3 -17.6%
0
0.0%
Construction Management Technology
3
0 0
0
0
-3 -100.0%
0
0.0%
Criminal Justice
293
186 205 205 273
-20 -6.8%
68 33.2%
Culinary Arts
103
52 79 70 79
-24 -23.3%
9 12.9%
Culinary Arts -Catering
1
12
N/A N/A
11 1100.0%
Dental Hygiene
2
2 0
0
0
-2 -100.0%
0
0.0%
Dental Laboratory Technology
5
0 0
0
0
-5 -100.0%
0
0.0%
Diagnostic Medical Sonography
50
41 56 55 62
12 24.0%
7 12.7%
Di t ti T h i i
27
9
15
19
18
9
33 3%
1
5 3%
Spring Full-time Enrollment History 2005-2009 by Program
Dietetic Technician
27
9 15
19
18
-9 -33.3%
-1 -5.3%
Drafting (Certificate)
1
1 0
0
0
-1 -100.0%
0
0.0%
Educational Interpreting for the Deaf
27
11 16 10 16
-11 -40.7%
6 60.0%
Electrical Construction Technician
14
14 23 13 24
10 71.4%
11 84.6%
Electrical Electronics Engineering Technology 68
35 46 66 65
-3 -4.4%
-1 -1.5%
Electronics Repair
2
0 0
0
0
-2 -100.0%
0
0.0%
Emergency Medical Technology
57
30 43 69 59
2 3.5%
-10 -14.5%
English as a Second Language
166
146 174 214 265
99 59.6%
51 23.8%
Entrepreneurship
1
9
N/A N/A
8 800.0%
EST-Biomedical Equip Repair Technology
35
25 16 12 17
-18 -51.4%
5 41.7%
EST-Computer Repair Technology
35
13 14 14 21
-14 -40.0%
7 50.0%
EST-Electronics Repair Technology
7
2 0
0
0
-7 -100.0%
0
0.0%
Fine Arts
46
35 33 49 57
11 23.9%
8 16.3%
Fire Protection Technology
24
7 18
20
37
13 54.2%
17 85.0%
Food Service Careers
0
N/A N/A
0 0.0%
Funeral Service Education
99
41 49 33 38
-61 -61.6%
5 15.2%
General Science
163
86 127 170 211
48 29.4%
41 24.1%
General Studies
760
474 538 679 733
-27 -3.6%
54 8.0%
Health Information Technology
49
24 28 24 23
-26 -53.1%
-1 -4.2%
Horticulture 10
8
7 18 8
-2 -20.0%
-10 -55.6%
Hospitality Management
52
31 33 47 47
-5 -9.6%
0
0.0%
Interior Design
85
51 52 58 51
-34 -40.0%
-7 -12.1%
IT- Machine Tool Technology
1
-1 -100.0%
0
0.0%
Legal Secretary
30
17 10 14 21
-9 -30.0%
7 50.0%
Business & Management
136
92 102 127 324
188 138.2%
197 155.1%
08/25/2009
14
Office of Institutional Research
Number % Number %
College Wide
Change Change Change Change
2005 2005 2008 2008
2005
2006 2007 2008 2009
to 2009 to 2009 to 2009 to 2009
Massage Therapy
12
8
12 8 19
7 58.3%
11 137.5%
Medical Coding - Certificate
34
11 30 27 42
8 23.5%
15 55.6%
Medical Laboratory Technician
53
28 26 26 30
-23 -43.4%
4 15.4%
Motor Vehicle Technology
131
86 87 86 79
-52 -39.7%
-7 -8.1%
Music
68
29 47 45 51
-17 -25.0%
6 13.3%
Nuclear Medicine Technology
19
15 11 13 13
-6 -31.6%
0
0.0%
Nursing
221
168 187 153 143
-78 -35.3%
-10 -6.5%
Occupational Therapy Assistant
27
12 11 28 30
3 11.1%
2 7.1%
Ophthalmic Medical Assistant
9
4 4 14 10
1 11.1%
-4 -28.6%
Pastry Art - Certificate
2
2 0
2
7
5 250.0%
5 250.0%
Performance & Media Arts
108
72 77 104 135
27 25.0%
31 29.8%
Pharmacy Technician
135
49 68 74 81
-54 -40.0%
7
9.5%
Physical Therapist Assisting
176
98 111 123 127
-49 -27.8%
4
3.3%
Practical Nursing
102
59 74 74 111
9 8.8%
37 50.0%
Pre-Nursing
1,293
755 889 1016 1084
-209 -16.2%
68 6.7%
Radiation Therapy (Certificate)
6
6
7 7 11
5 83.3%
4 57.1%
Radiologic Technology
458
271 331 320 350
-108 -23.6%
30 9.4%
Real Estate Agent
1
1
0
N/A N/A
-1 -100.0%
Respiratory Care Technology
65
36 21 50 54
-11 -16.9%
4
8.0%
Safety & Health Technology
13
15 9
14
12
-1 -7.7%
-2 -14.3%
Surgical Technology
71
23 31 43 43
-28 -39.4%
0
0.0%
Teaching Grades 1-5
60 110
N/A N/A
50 83.3%
Veterinary Technology
6
18 38 47 60
54 900.0%
13 27.7%
Visual Communications
92
48 55 70 75
-17 -18.5%
5
7.1%
Website Developer
4
8
16
N/A
N/A
8
100 0%
Spring Full-time Enrollment History 2005-2009 by Program
W
ebsite Developer
4
8 16
N/A
N/A
8
100.0%
Welding Technology
0
0 0
0
0
0 0.0%
0 0.0%
Workforce
0
0 0
0
3
3 0.0%
3 0.0%
Total
7,108 4,134 4,951 5,644 6,497
-611 -8.6%
853 15.1%
*
Formerly named Early Childhood Education
Number % Number %
College Wide
Change Change Change Change
2005 2005 2008 2008
2005
2006 2007 2008 2009
to 2009 to 2009 to 2009 to 2009
Accounting
231
149 162 184 195
-36 -15.6%
11 6.0%
Administrative Office Tech
80
52 41 39 38
-42 -52.5%
-1 -2.6%
Air Conditioning & Refrigeration
2
1
-2 -100.0%
N/A
N/A
American Sign Language Studies
32
13 16 12 12
-20 -62.5%
0
0.0%
Business Administration
565
319 424 448 360
-205 -36.3%
-88 -19.6%
Business Training
1
-1 -100.0%
0
0.0%
Care & Development of Young Children
551
224 241 229 209
-342 -62.1%
-20 -8.7%
Carpentry
4
0
1
-4 -100.0%
0
0.0%
Certified Nurse Assistant
1
0 0
0
0
N/A N/A
N/A
N/A
CET-Architectural Engineering
48
38 45 57 42
-6 -12.5%
-15 -26.3%
CET-Civil Construction Technology
29
15 13 22 23
-6 -20.7%
1
4.5%
CET-Construction Management
26
15 26 37 37
11 42.3%
0 0.0%
Computer Aided Drafting & Design -CADD
41
45 69 88 136
95 231.7%
48 54.5%
Computer Information Technology
198
119 102 116 122
-76 -38.4%
6
5.2%
Computer Network Technology
90
65 60 58 69
-21 -23.3%
11 19.0%
Computer Repair (Certificate)
22
7 13
19
20
-2 -9.1%
1
5.3%
Construction Management Technology
5
3
N/A N/A
N/A
N/A
Spring Part-time Enrollment History 2005-2009 by Program
08/25/2009
15
Office of Institutional Research
Number % Number %
College Wide
Change Change Change Change
2005 2005 2008 2008
2005
2006 2007 2008 2009
to 2009 to 2009 to 2009 to 2009
Criminal Justice
253
175 175 194 175
-78 -30.8%
-19 -9.8%
Culinary Arts
112
65 83 104 103
-9 -8.0%
-1 -1.0%
Culinary Arts -Catering
3
9
N/A N/A
6 200.0%
Dental Hygiene
4
2 2
0
0
-4 -100.0%
0
0.0%
Dental Laboratory Technology
3
1 0
0
0
-3 -100.0%
0
0.0%
Diagnostic Medical Sonography
65
39 61 61 79
14 21.5%
18 29.5%
Dietetic Technician
33
18 17 15 19
-14 -42.4%
4 26.7%
Drafting (Certificate)
5
1
N/A N/A
N/A
N/A
Educational Interpreting for the Deaf
32
17 24 19 4
-28 -87.5%
-15 -78.9%
Electrical Construction Technician
15
9 32
30
30
15 100.0%
0 0.0%
Electrical Electronics Engineering Technology 89
40 63 66 72
-17 -19.1%
6
9.1%
Electronics Repair
2
1 0
0
0
-2 -100.0%
0
0.0%
Emergency Medical Technology
121
68 81 60 83
-38 -31.4%
23 38.3%
English as a Second Language
80
49 57 80 154
74 92.5%
74 92.5%
Entrepreneurship
0
6
N/A N/A
6 0.0%
EST-Biomedical Equip Repair Technology
34
10 20 13 9
-25 -73.5%
-4
-30.8%
EST-Computer Repair Technology
19
9 13
17
23
4 21.1%
6 35.3%
EST-Electronics Repair Technology
9
2 0
0
1
-8 -88.9%
1
0.0%
Fine Arts
111
55 78 85 103
-8 -7.2%
18 21.2%
Fire Protection Technology
154
61 75 71 60
-94 -61.0%
-11 -15.5%
Food Service Careers
3
0 0
0
0
-3 -100.0%
0
0.0%
Funeral Service Education
70
54 42 45 32
-38 -54.3%
-13 -28.9%
General Science
177
110 151 194 251
74 41.8%
57 29.4%
General Studies
1,244
708 783 866 918
-326 -26.2%
52 6.0%
Spring Part-time Enrollment History 2005-2009 by Program
Health Information Technology
103
57 41 49 45
-58 -56.3%
-4 -8.2%
Horticulture 38
27 30 23 33
-5 -13.2%
10 43.5%
Hospitality Management
30
19 24 22 33
3 10.0%
11 50.0%
Interior Design
92
51 60 59 59
-33 -35.9%
0
0.0%
IT- Machine Tool Technology
12
2
N/A N/A
N/A
N/A
Legal Secretary
38
19 24 24 31
-7 -18.4%
7 29.2%
Business & Management
134
72 87 97 220
86 64.2%
123 126.8%
Massage Therapy
22
22 31 36 27
5 22.7%
-9 -25.0%
Medical Coding - Certificate
58
53 59 84 99
41 70.7%
15 17.9%
Medical Laboratory Technician
114
51 66 68 71
-43 -37.7%
3
4.4%
Motor Vehicle Technology
110
56 82 236 57
-53 -48.2%
-179 -75.8%
Music
65
24 27 37 52
-13 -20.0%
15 40.5%
Nuclear Medicine Technology
27
13 22 12 12
-15 -55.6%
0
0.0%
Nursing
594
451 552 561 543
-51 -8.6%
-18 -3.2%
Occupational Therapy Assistant
35
16 29 20 23
-12 -34.3%
3 15.0%
Ophthalmic Medical Assistant
4
0 1
5
2
-2 -50.0%
-3 -60.0%
Pastry Art - Certificate
3
3
0 3 13
10 333.3%
10 333.3%
Performance & Media Arts
92
46 57 72 54
-38 -41.3%
-18 -25.0%
Pharmacy Technician
141
65 60 79 101
-40 -28.4%
22 27.8%
Physical Therapist Assisting
170
112 115 123 128
-42 -24.7%
5
4.1%
Practical Nursing
112
60 72 64 58
-54 -48.2%
-6 -9.4%
Pre-Nursing
1,989
1395 1616 1641 1768
-221 -11.1%
127 7.7%
Radiation Therapy (Certificate)
8
9 16
18
29
21 262.5%
11 61.1%
Radiologic Technology
690
435 462 510 506
-184 -26.7%
-4 -0.8%
Real Estate Agent
6
3
0
N/A N/A
-3 -100.0%
Respiratory Care Technology
112
67 82 114 110
-2 -1.8%
-4 -3.5%
*
Formerly named Early Childhood Education
08/25/2009
16
Office of Institutional Research
Number % Number %
College Wide
Change Change Change Change
2005 2005 2008 2008
2005
2006 2007 2008 2009
to 2009 to 2009 to 2009 to 2009
Safety & Health Technology
23
17 16 16 15
-8 -34.8%
-1 -6.3%
Surgical Technology
196
100 117 139 163
-33 -16.8%
24 17.3%
Teaching Grades 1-5
47 96
N/A N/A
49 104.3%
Veterinary Technology
9
13 29 57 62
53 588.9%
5 8.8%
Visual Communications
97
53 66 66 74
-23 -23.7%
8 12.1%
Website Developer
3
15
17
N/A N/A
2 13.3%
Welding Technology
0
0 0
0
0
0 0.0%
0 0.0%
Workforce
0
0 0 0 264
264 0.0%
264 0.0%
Total
9,679 5,867 6,822 7,532 8,159
-1,520 -15.7%
627 8.3%
Number
% Number
%
Total College Wide
Change
Change
Change
Change
2005 2005 2008 2008
2005
2006 2007 2008 2009
to 2009 to 2009 to 2009 to 2009
Accounting
489
254 331 367 409
-80 -16.4%
42 11.4%
Administrative Office Tech
137
85 78 82 75
-62 -45.3%
-7 -8.5%
Air Conditioning & Refrigeration
2
1
N/A N/A
N/A
N/A
American Sign Language Studies
39
18 24 24 21
-18 -46.2%
-3 -12.5%
Business Administration
1,108
641 912 1,003
918
-190 -17.1%
-85 -8.5%
Business Training
1
N/A N/A
N/A
N/A
Carpentry
4
1
1
N/A N/A
N/A
N/A
Care & Development of Young Children
873
403 398 367 361
-512 -58.6%
-6 -1.6%
Spring Part-time Enrollment History 2005-2009 by Program
Spring Enrollment History 2005-2009 by Program
Certified Nurse Assistant
1
0 0
0
0
N/A N/A
N/A
N/A
CET-Architectural Engineering
120
90 91 115 102
-18 -15.0%
-13 -11.3%
CET-Civil Construction Technology
46
22 30 40 45
-1 -2.2%
5 12.5%
CET-Construction Management
54
25 53 62 70
16 29.6%
8 12.9%
Computer Information Technology
376
203 202 218 227
-149 -39.6%
9
4.1%
Computer Network Technology
204
131 105 107 132
-72 -35.3%
25 23.4%
Computer Repair (Certificate)
39
13 23 33 34
-5 -12.8%
1
3.0%
Construction Management Technology
8
3
N/A N/A
N/A
N/A
Criminal Justice
546
361 380 399 448
-98 -17.9%
49 12.3%
Culinary Arts
215
117 162 174 182
-33 -15.3%
8
4.6%
Culinary Arts -Catering
4
21
N/A N/A
N/A
N/A
Dental Hygiene
6
4
2
N/A N/A
N/A
N/A
Dental Laboratory Technology
8
1
N/A N/A
N/A
N/A
Diagnostic Medical Sonography
115
80 117 116 141
26 22.6%
25 21.6%
Dietetic Technician
60
27 32 34 37
-23 -38.3%
3
8.8%
Computer Aided Drafting & Design -CADD
85
63 101 134 200
115 135.3% 66 49.3%
Drafting (Certificate) 6
2
N/A N/A N/A N/A
Educational Interpreting for the Deaf 59
28 40 29 20
-39 -66.1%
-9 -31.0%
Electrical Construction Technician
29
23 55 43 54
25 86.2%
11 25.6%
Electrical Electronics Engineering Technology 157
75 109 132 137
-20 -12.7%
5
3.8%
Electronics Repair
4
1
N/A N/A
N/A
N/A
Emergency Medical Technology
178
98 124 129 142
-36 -20.2%
13 10.1%
English as a Second Language
246
195 231 294 419
173 70.3%
125 42.5%
Entrepreneurship
1
15
N/A N/A
14 1400.0%
EST-Biomedical Equip Repair Technology
69
35 36 25 26
-43 -62.3%
1
4.0%
EST-Computer Repair Technology
54
22 27 31 44
-10 -18.5%
13 41.9%
EST-Electronics Repair Technology
16
4 0
0
1
-15 -93.8%
1
0.0%
Fine Arts
157
90 111 134 160
3 1.9%
26 19.4%
Fire Protection Technology
178
68 93 91 97
-81 -45.5%
6
6.6%
Food Service Careers
3
N/A N/A
N/A
N/A
Funeral Service Education
169
95 91 78 70
-99 -58.6%
-8 -10.3%
08/25/2009
17
Office of Institutional Research
Number % Number %
Total College Wide
Change
Change
Change
Change
2005 2005 2008 2008
2005 2006
2007 2008 2009
to 2009 to 2009 to 2009 to 2009
General Science
340 196
278 364 462
122 35.9%
98 26.9%
General Studies
2,004 1,182
1321 1545 1651
-353 -17.6%
106 6.9%
Health Information Technology
152 81
69 73 68
-84 -55.3%
-5 -6.8%
Horticulture 48 35
37 41 41
-7 -14.6%
0
0.0%
Hospitality Management
82 50
57 69 80
-2 -2.4%
11 15.9%
Interior Design
177 102
112 117 110
-67 -37.9%
-7 -6.0%
IT- Machine Tool Technology
13 2
N/A N/A
N/A
N/A
Legal Secretary
68 36
34 38 52
-16 -23.5%
14 36.8%
Business & Management
270 164
189 224 544
274 101.5%
320 142.9%
Massage Therapy
34 30
43 44 46
12 35.3%
2 4.5%
Medical Coding - Certificate
92 64
89 111 141
49 53.3%
30 27.0%
Medical Laboratory Technician
167 79
92 94 101
-66 -39.5%
7
7.4%
Motor Vehicle Technology
241 142
169 322 136
-105 -43.6%
-186 -57.8%
Music
133 53
74 82 103
-30 -22.6%
21 25.6%
Nuclear Medicine Technology
46 28
33 25 25
-21 -45.7%
0
0.0%
Nursing
815 619
739 714 686
-129 -15.8%
-28 -3.9%
Occupational Therapy Assistant
62 28
40 48 53
-9 -14.5%
5 10.4%
Ophthalmic Medical Assistant
13 4
5
19
12
-1 -7.7%
-7 -36.8%
Pastry Art - Certificate
5 5
0
5 20
15 300.0%
15 300.0%
Performance & Media Arts
200 118
134 176 189
-11 -5.5%
13 7.4%
Pharmacy Technician
276 114
128 153 182
-94 -34.1%
29 19.0%
Physical Therapist Assisting
346 210
226 246 255
-91 -26.3%
9
3.7%
Practical Nursing
214 119
146 138 169
-45 -21.0%
31 22.5%
Pre-Nursing
3,282 2,150
2505 2657 2852
-430 -13.1%
195 7.3%
Radiologic Technology
1,148 706
793 830 856
-292 -25.4%
26 3.1%
Radiation Therapy (Certificate)
14 15
23
25
40
26 185.7%
15 60.0%
Spring Enrollment History 2005-2009 by Program (cont.)
Radiation
Therapy (Certificate)
14
15
23
25
40
26
185.7%
15
60.0%
Real Estate Agent
7
4
0
N/A N/A
-4 -100.0%
Respiratory Care Technology
177 103
103 164 164
-13 -7.3%
0
0.0%
Safety & Health Technology
36 32
25 30 27
-9 -25.0%
-3 -10.0%
Surgical Technology
267 123
148 182 206
-61 -22.8%
24 13.2%
Teaching Grades 1-5
107
206
N/A N/A
99 92.5%
Veterinary Technology
15 31
67 104 122
107 713.3%
18 17.3%
Visual Communications
189 101
121 136 149
-40 -21.2%
13 9.6%
Website Developer
7
23 33
N/A N/A
10 43.5%
Welding Technology
0 0
0
0
0
0 0.0%
0 0.0%
Workforce
0 0
0 0 267
267 0.0%
267 0.0%
Total
16,787 10,001 11,773 13,176 14,656
-2,131 -12.7%
1,480 11.2%
Number % Number %
Total City Park Campus
Change Change Change Change
2005 2005 2008 2008
2005
2006 2007 2008 2009
to 2009 to 2009 to 2009 to 2009
Accounting
358 164 206 225 266
-92 -25.7%
41 18.2%
Administrative Office Technology
106 53 52 60 54
-52 -49.1%
-6 -10.0%
Air Conditioning & Refrigeration
2 1
N/A N/A
N/A
N/A
American Sign Language Studies
30 10 20 20 19
-11 -36.7%
-1 -5.0%
Business Administration
803 393 618 655 616
-187 -23.3%
-39 -6.0%
Business Training
1
-1 -100.0%
N/A
N/A
Carpentry
4 1 1
-4 -100.0%
N/A
N/A
Certified Nurse Assistant
0 0 0 0 0
N/A N/A
N/A
N/A
CET-Architectural Technology
104 66 70 89 80
-24 -23.1%
-9 -10.1%
CET-Civil Construction Technology
41 18 22 31 33
-8 -19.5%
2
6.5%
Spring Enrollment History 2005-2009 by Campus
08/25/2009
18
Office of Institutional Research
Number % Number %
City Park Campus, continued
Change Change Change Change
2005 2005 2008 2008
2005
2006 2007 2008 2009
to 2009 to 2009 to 2009 to 2009
CET-Construction Management
46 18 41 52 58
12 26.1%
6 11.5%
Computer Information Technology
281 148 138 163 155
-126 -44.8%
-8 -4.9%
Computer Network Technology
187 107 82 81 102
-85 -45.5%
21 25.9%
Computer Repair (Certificate)
34 8 21 28 25
-9 -26.5%
-3 -10.7%
Construction Management Technology
8 3
N/A N/A
N/A
N/A
Criminal Justice
367 202 223 253 281
-86 -23.4%
28 11.1%
Culinary Arts
192 107 140 145 154
-38 -19.8%
9
6.2%
Culinary Arts -Catering
2
19
N/A N/A
17 850.0%
Dental Hygiene
3 1 0 0 0
-3 -100.0%
N/A
N/A
Computer Aided Drafting & Design -CADD
65 39 77 91 143
78 120.0%
52 57.1%
Care & Development of Young Children
578 230 223 242 240
-338 -58.5%
-2 -0.8%
Dental Laboratory Technology
5 0 0 0 0
-5 -100.0%
N/A
N/A
Diagnostic Medical Sonography
89 53 87 82 102
13 14.6%
20 24.4%
Dietetic Technician
51 22 24 27 31
-20 -39.2%
4 14.8%
Drafting (Certificate)
4 1 0 0 0
N/A N/A
N/A
N/A
Educational Interpreting for the Deaf
46 20 28 21 17
-29 -63.0%
-4 -19.0%
Electrical Construction Technician
28 21 51 41 52
24 85.7%
11 26.8%
Electrical Electronics Engineering Technology 138 58 88 107 103
-35 -25.4%
-4 -3.7%
Electronics Repair
4 1
N/A N/A
N/A
N/A
Emergency Medical Technology
151 86 98 77 89
-62 -41.1%
12 15.6%
English as a Second Language
244 195 230 293 416
172 70.5%
123 42.0%
Entrepreneurship
0
9
N/A N/A
9 0.0%
EST-Biomedical Equip Repair Technology
62 31 34 22 25
-37 -59.7%
3 13.6%
EST-Computer Repair Technology
39 10 16 23 34
-5 -12.8%
11 47.8%
EST-Electronics Repair Technology
15 4 0 0 1
-14 -93.3%
1
0.0%
Fine Arts
106
49
63
85
99
-7
-6 6%
14
16 5%
Spring Enrollment History 2005-2009 by Campus (cont.)
Fine
Arts
106
49
63
85
99
-7
-6.6%
14
16.5%
Fire Protection Technology
119 63 56 84 85
-34 -28.6%
1
1.2%
Food Service Careers
3
N/A N/A
N/A
N/A
Funeral Service Education
142 74 70 65 60
-82 -57.7%
-5 -7.7%
General Science
233 128 166 226 287
54 23.2%
61 27.0%
General Studies
1,358 638 754 911 1,009
-349 -25.7%
98 10.8%
Health Information Technology
118 70 57 55 43
-75 -63.6%
-12 -21.8%
Horticulture 46 34 33 39 40
-6 -13.0%
1
2.6%
Hospitality Management
77 47 51 62 71
-6 -7.8%
9 14.5%
Interior Design
153 81 91 102 99
-54 -35.3%
-3 -2.9%
IT- Machine Tool Technology
12 2
N/A N/A
N/A
N/A
Legal Secretary
46 26 21 30 40
-6 -13.0%
10 33.3%
Business & Management
193 99 125 164 369
176 91.2%
205 125.0%
Manufacturing
1
N/A N/A
N/A
N/A
Massage Therapy
4 5 6 10 9
5 125.0%
-1 -10.0%
Medical Coding - Certificate
79 47 67 90 98
19 24.1%
8 8.9%
Medical Laboratory Technician
123 51 69 68 78
-45 -36.6%
10 14.7%
Motor Vehicle Technology
225 129 158 309 129
-96 -42.7%
-180 -58.3%
Music
120 40 62 65 87
-33 -27.5%
22 33.8%
Nuclear Medicine Technology
32 16 22 20 17
-15 -46.9%
-3 -15.0%
Nursing
0 0 0 0 0
0 0.0%
0 0.0%
Occupational Therapy Assistant
46 24 32 36 38
-8 -17.4%
2
5.6%
Ophthalmic Medical Assistant
12 4 5 18 11
-1 -8.3%
-7 -38.9%
Pastry Art - Certificate
5 5 0 5 17
12 240.0%
12 240.0%
Performance & Media Arts
176 88 102 143 150
-26 -14.8%
7
4.9%
Pharmacy Technician
207 69 87 105 114
-93 -44.9%
9
8.6%
Physical Therapist Assisting
247 133 135 168 163
-84 -34.0%
-5 -3.0%
Practical Nursing
94 32 42 54 50
-44 -46.8%
-4 -7.4%
Pre-Nursing
2,056 1,171 1,366 1,532 1,626
-430 -20.9%
94 6.1%
Radiologic Technology
783 426 466 518 536
-247 -31.5%
18 3.5%
Radiation Therapy (Certificate)
14 12 20 12 26
12 85.7%
14 116.7%
08/25/2009
19
Office of Institutional Research
Number % Number %
City Park Campus, continued
Change Change Change Change
2005 2005 2008 2008
2005 2006
2007 2008 2009
to 2009 to 2009 to 2009 to 2009
Real Estate Agent
7 4 0
N/A N/A
-4 -100.0%
Respiratory Care Technology
127 67 69 109 92
-35 -27.6%
-17 -15.6%
Safety & Health Technology
34 27 17 26 20
-14 -41.2%
-6 -23.1%
Surgical Technology
189 88 103 127 117
-72 -38.1%
-10 -7.9%
Teaching Grades 1-5
60
127
N/A N/A
67 111.7%
Veterinary Technology
13 28 48 79 60
47 361.5%
-19 -24.1%
Visual Communications
162 82 93 108 116
-46 -28.4%
8
7.4%
Website Developer
6 20 24
N/A N/A
4 20.0%
Welding Technology
0 0 0 0 0
0 0.0%
0 0.0%
Workforce
0 0 0 0 5
5 0.0%
5 0.0%
Total
11,441 5,926 7,059 8,339 9,036
-2,405 -21.0%
697 8.4%
Number
% Number
%
Change Change Change Change
2005 2005 2008 2008
2005
2006 2007 2008 2009
to 2009 to 2009 to 2009 to 2009
Accounting
90 71 97 108 104
14 15.6%
-4 -3.7%
Administrative Office Technology*
29 25 20 16 17
-12 -41.4%
1
6.3%
Air Conditioning & Refrigeration
0 0
N/A N/A
N/A
N/A
American Sign Language Studies
6 7 4 3 1
-5 -83.3%
-2 -66.7%
Business Administration
213 187 189 200 177
-36 -16.9%
-23 -11.5%
Business Training
0
N/A N/A
N/A
N/A
Care & Development of Young Children
220
122
119
94
96
-124
-56 4%
2
2 1%
Total West Bank Campus
Spring Enrollment History 2005-2009 by Campus (cont.)
Care & Development of Young Children
220
122
119
94
96
-124
-56.4%
2
2.1%
Carpentry
0
N/A N/A
N/A
N/A
Certified Nurse Assistant
0 0
N/A N/A
N/A
N/A
CET-Architectural Technology
13 15 12 19 18
5 38.5%
-1 -5.3%
CET-Civil Construction Technology
4 3 6 7 10
6 150.0%
3 42.9%
CET-Construction Management
4 5 10 6 6
2 50.0%
0 0.0%
Computer Aided Drafting & Design -CADD
16 22 21 34 47
31 193.8%
13 38.2%
Computer Information Technology
79 43 47 43 53
-26 -32.9%
10 23.3%
Computer Network Technology
11 16 16 12 16
5 45.5%
4 33.3%
Computer Repair (Certificate)
1 5 0 4 7
6 600.0%
3 75.0%
Construction Management Technology
0 0
N/A N/A
N/A
N/A
Criminal Justice
143 131 120 109 117
-26 -18.2%
8
7.3%
Culinary Arts
16 7 14 17 18
2 12.5%
1 5.9%
Culinary Arts -Catering
0 0 0
2
1
1
0.0%
-1 -50.0%
Dental Hygiene
3 3 2
N/A N/A
N/A
N/A
Dental Laboratory Technology
0 0
0 0.0%
0 0.0%
Diagnostic Medical Sonography
10 13 19 17 21
11 110.0%
4 23.5%
Dietetic Technician
5 5 6 4 3
-2 -40.0%
-1 -25.0%
Drafting (Certificate)
2 1
N/A N/A
N/A
N/A
Educational Interpreting for the Deaf
9 6 9 5 3
-6 -66.7%
-2 -40.0%
Electrical Construction Technician
0 2 3 1 1
1 0.0%
0 0.0%
Electrical Electronics Engineering Technology 15 16 17 19 25
10 66.7%
6 31.6%
Electronics Repair
0 0
N/A N/A
N/A
N/A
Emergency Medical Technology
25 9 22 21 18
-7 -28.0%
-3 -14.3%
English as a Second Language
1 0 1 0 3
2 200.0%
3
0.0%
Entrepreneurship
0
1
N/A N/A
1 0.0%
EST-Biomedical Equip Repair Technology
2 1 0 2 1
-1 -50.0%
-1 -50.0%
EST-Computer Repair Technology
11 9 10 5 8
-3 -27.3%
3 60.0%
EST-Electronics Repair Technology
1 0 0 0 0
-1 -100.0%
0
0.0%
Fine Arts
47 39 39 41 45
-2 -4.3%
4
9.8%
Fire Protection Technology
10 1 3 2 1
-9 -90.0%
-1 -50.0%
08/25/2009
20
Office of Institutional Research
Number
% Number
%
Change Change Change Change
2005 2005 2008 2008
2005
2006 2007 2008 2009
to 2009 to 2009 to 2009 to 2009
Food Service Careers
0
N/A N/A
N/A
N/A
Funeral Service Education
21 17 17 11 7
-14 -66.7%
-4 -36.4%
General Science
79 59 96 112 134
55 69.6%
22 19.6%
General Studies
442 391 364 375 329
-113 -25.6%
-46 -12.3%
Health Information Technology
23 10 8 9 20
-3 -13.0%
11 122.2%
Horticulture 1 0 1 2 0
-1 -100.0%
-2 -100.0%
Hospitality Management
3 1 4 4 6
3 100.0%
2 50.0%
Interior Design
15 17 12 12 7
-8 -53.3%
-5 -41.7%
IT- Machine Tool Technology
0 0
N/A N/A
N/A
N/A
Legal Secretary
20 7 11 8 9
-11 -55.0%
1 12.5%
Business & Management
51 48 46 40 99
48 94.1%
59 147.5%
Massage Therapy
30 24 36 34 33
3 10.0%
-1 -2.9%
Medical Coding - Certificate
5 11 20 12 20
15 300.0%
8 66.7%
Medical Laboratory Technician
28 21 14 19 11
-17 -60.7%
-8 -42.1%
Motor Vehicle Technology
8 11 10 7 4
-4 -50.0%
-3 -42.9%
Music
7 8 6 9 10
3 42.9%
1 11.1%
Nuclear Medicine Technology
7 4 6 2 4
-3 -42.9%
2 100.0%
Nursing
0 0 0 0 0
0 0.0%
0 0.0%
Occupational Therapy Assistant
9 3 4 5 5
-4 -44.4%
0
0.0%
Ophthalmic Medical Assistant
0 0 0 0 0
0 0.0%
0 0.0%
Pastry Art - Certificate
0 0 0 0 1
1 0.0%
1 0.0%
Performance & Media Arts
17 20 25 22 26
9 52.9%
4 18.2%
Pharmacy Technician
54 37 35 37 38
-16 -29.6%
1
2.7%
Physical Therapist Assisting
69 50 62 49 50
-19 -27.5%
1
2.0%
Practical Nursing
45 34 41 33 36
-9 -20.0%
3
9.1%
Pre-Nursing
789
620
757
689
716
-73
-9.3%
27
3.9%
Spring Enrollment History 2005-2009 by Campus (cont.)
Total West Bank Campus
Pre-Nursing
789
620
757
689
716
-73
-9
.3%
27
3.9%
Radiologic Technology
0 2 2 167 169
169 0.0%
2 1.2%
Radiation Therapy (Certificate)
193 153 191 9 7
-186 -96.4%
-2 -22.2%
Real Estate Agent
0 0 0
N/A N/A
0 0.0%
Respiratory Care Technology
42 18 22 28 37
-5 -11.9%
9 32.1%
Safety & Health Technology
1 4 4 5 6
5 500.0%
1 20.0%
Surgical Technology
48 24 28 34 34
-14 -29.2%
0
0.0%
Teaching Grades 1-5
20 33
N/A N/A
13 65.0%
Veterinary Technology
1 1 10 11 16
15 1500.0%
5 45.5%
Visual Communications*
17 10 16 19 23
6 35.3%
4 21.1%
Website Developer
1 1 5
N/A N/A
4 400.0%
Welding Technology
0 0 0 0 0
0 0.0%
0 0.0%
Workforce
0 0 0 0 261
N/A N/A
N/A
N/A
Total
3,011 2,369 2,655 2,576 2,974
-37 -1.2%
398 15.5%
Number
% Number
%
Total Charity Campus
Change
Change
Change
Change
2005 2005 2008 2008
2005 2006
2007 2008 2009
to 2009 to 2009 to 2009 to 2009
Certified Nurse Assistant
1
N/A N/A
N/A
N/A
Nursing
815 619
739 714 702
-113 -13.9% -12 -1.7%
Practical Nursing
54 39
48 42 68
14 25.9%
26 61.9%
Total
870 658 787 756 770
-100 -11.5%
14 1.9%
08/25/2009
21
Office of Institutional Research
Number
% Number
%
Total Northshore Site
Change Change Change Change
2005 2005 2008 2008
2005
2006 2007 2008 2009
to 2009 to 2009 to 2009 to 2009
Accounting
41
19 28 34 39
-2 -4.9%
5 14.7%
Administrative Office Technology*
2
7 6
6
4
2 100.0%
-2 -33.3%
Air Conditioning & Refrigeration
0
0
N/A N/A
N/A
N/A
American Sign Language Studies
3
1 0
1
1
-2 -66.7%
0
0.0%
Business Administration
92
61 105 148 125
33 35.9%
-23 -15.5%
Business Training
0
N/A N/A
N/A
N/A
Care & Development of Young Children
75
51 56 31 25
-50 -66.7%
-6 -19.4%
Carpentry
0
0
N/A N/A
N/A
N/A
Certified Nurse Assistant
0
0
N/A N/A
N/A
N/A
CET-Architectural Technology
3
9 9
7
4
1 33.3%
-3 -42.9%
CET-Civil Construction Technology
1
1 2
2
2
1 100.0%
0 0.0%
CET-Construction Management
4
2 2
4
6
2 50.0%
2 50.0%
Computer Aided Drafting & Design -CADD
4
2
3 9 10
6 150.0%
1 11.1%
Computer Information Technology
16
12 17 12 19
3 18.8%
7 58.3%
Computer Network Technology
6
8 7 14 14
8 133.3%
0 0.0%
Computer Repair (Certificate)
4
0 2
1
2
-2 -50.0%
1 100.0%
Construction Management Technology
0
0
N/A N/A
N/A
N/A
Criminal Justice
36
28 37 37 50
14 38.9%
13 35.1%
Culinary Arts
7
3 8 12 10
3 42.9%
-2 -16.7%
Culinary Arts -Catering
0
1
N/A N/A
1 0.0%
Dental Hygiene
0
0
N/A N/A
N/A
N/A
Dental Laboratory Technology
3
1
N/A N/A
N/A
N/A
Diagnostic Medical Sonography
16
14 11 17 18
2 12.5%
1 5.9%
Dietetic Technician
4
0 2
3
3
-1 -25.0%
0
0.0%
Drafting (Certificate)
0
0
N/A
N/A
N/A
N/A
Spring Enrollment History 2005-2009 by Campus (cont.)
Drafting
(Certificate)
0
0
N/A
N/A
N/A
N/A
Educational Interpreting for the Deaf
4
2 3
3
0
-4 -100.0%
-3 -100.0%
Electrical Construction Technician
1
0 1
1
1
0 0.0%
0 0.0%
Electrical Electronics Engineering Technology 4
1 4
6
9
5 125.0%
3 50.0%
Electronics Repair
0
0
N/A N/A
N/A
N/A
Emergency Medical Technology
2
3 4 31 35
33 1650.0%
4 12.9%
English as a Second Language
1
0 0
1
0
-1 -100.0%
-1 -100.0%
Entrepreneurship
1
5
N/A N/A
4 400.0%
EST-Biomedical Equip Repair Technology
5
3 2
1
0
-5 -100.0%
-1 -100.0%
EST-Computer Repair Technology
4
3 1
3
2
-2 -50.0%
-1 -33.3%
EST-Electronics Repair Technology
0
0 0
0
0
0 0.0%
0 0.0%
Fine Arts
4
2
9 8 16
12 300.0%
8 100.0%
Fire Protection Technology
49
4
34 5 11
-38 -77.6%
6 120.0%
Food Service Careers
0
0
N/A N/A
N/A
N/A
Funeral Service Education
6
4 4
2
3
-3 -50.0%
1 50.0%
General Science
28
9 16
26
41
13 46.4%
15 57.7%
General Studies
204
153 203 259 313
109 53.4%
54 20.8%
Health Information Technology
11
1 4
9
5
-6 -54.5%
-4 -44.4%
Horticulture 1
1 3
0
1
0 0.0%
1 0.0%
Hospitality Management
2
2 2
3
3
1 50.0%
0 0.0%
Interior Design
9
4 9
3
4
-5 -55.6%
1 33.3%
IT- Machine Tool Technology
0
N/A N/A
N/A
N/A
Legal Secretary
2
3 2
0
3
1 50.0%
3 0.0%
Machine Tool Technology (Certificate)*
N/A N/A
N/A
N/A
Business & Management
26
17 18 20 76
50 192.3%
56 280.0%
Massage Therapy
0
1 1
0
4
4 0.0%
4 0.0%
Medical Coding - Certificate
8
6
2 9 23
15 187.5%
14 155.6%
Medical Laboratory Technician
16
7
9 7 12
-4 -25.0%
5 71.4%
Motor Vehicle Technology
8
2 1
6
3
-5 -62.5%
-3 -50.0%
Music
6
5 6
7
6
0
0.0%
-1 -14.3%
08/25/2009
22
Office of Institutional Research
Number
% Number
%
Northshore Site
Change Change Change Change
2005 2005 2008 2008
2005 2006
2007 2008 2009
to 2009 to 2009 to 2009 to 2009
Nuclear Medicine Technology
7 8
5
3
4
-3 -42.9%
1 33.3%
Nursing
0 0
0
0
0
0 0.0%
0 0.0%
Occupational Therapy Assistant
7 1
4
7 10
3 42.9%
3 42.9%
Ophthalmic Medical Assistant
1 0
0
1
1
0 0.0%
0 0.0%
Pastry Art - Certificate
0 0
0
0
2
2 0.0%
2 0.0%
Performance & Media Arts
7 10
7
11
13
6 85.7%
2 18.2%
Pharmacy Technician
15 8
6
11
30
15 100.0%
19 172.7%
Physical Therapist Assisting
30 27
29 29 42
12 40.0%
13 44.8%
Practical Nursing
21 14
15 9 15
-6 -28.6%
6 66.7%
Pre-Nursing
437 359
382 436 494
57 13.0%
58 13.3%
Radiation Therapy (Certificate)
0 1
1
4
7
7 0.0%
3 75.0%
Radiologic Technology
172 127
136 145 151
-21 -12.2%
6
4.1%
Real Estate Agent
0 0 0
0 0.0%
0 0.0%
Respiratory Care Technology
8 18
12 27 35
27 337.5%
8 29.6%
Safety & Health Technology
1 1
4
0
1
0 0.0%
1 0.0%
Surgical Technology
30 11
17 21 55
25 83.3%
34 161.9%
Teaching Grades 1-5
27
46
46 0.0%
19 70.4%
Veterinary Technology
1 2
9
14
46
45 4500.0%
32 228.6%
Visual Communications
10 9
12 9 10
0 0.0%
1 11.1%
Website Developer
0 2 4
4 0.0%
2 100.0%
Welding Technology
0 0
0
0
0
0 0.0%
0 0.0%
Workforce
0 0
0
0
1
1 0.0%
1 0.0%
Total
1,465 1,048 1,272 1,505 1,876
411 28.1%
371 24.7%
Spring Enrollment History 2005-2009 by Campus (cont.)
Ranked by Student Total
Number
% Number
%
College Wide
Change
Change
Change
Change
2005 2005 2008 2008
2005
2006 2007 2008 2009
to 2009 to 2009 to 2009 to 2009
Pre-Nursing
3,282 2,150
2505 2657 2852
-430 -13.1%
195 7.3%
General Studies
2,004 1,182
1321 1545 1651
-353 -17.6%
106 6.9%
Business Administration
1,108
641 912 1,003
918
-190 -17.1%
-85 -8.5%
Radiologic Technology
1,148 706
793 830 856
-292 -25.4%
26 3.1%
Nursing
815 619
739 714 686
-129 -15.8%
-28 -3.9%
Business & Management
270 164
189 224 544
274 101.5%
320 142.9%
General Science
340 196
278 364 462
122 35.9%
98 26.9%
Criminal Justice
546
361 380 399 448
-98 -17.9%
49 12.3%
English as a Second Language
246
195 231 294 419
173 70.3%
125 42.5%
Accounting
489
254 331 367 409
-80 -16.4%
42 11.4%
Care & Development of Young Children
873
403 398 367 361
-512 -58.6%
-6 -1.6%
Workforce
0 0
0 0 267
N/A N/A
N/A
N/A
Physical Therapist Assisting
346 210
226 246 255
-91 -26.3%
9
3.7%
Computer Information Technology
376
203 202 218 227
-149 -39.6%
9
4.1%
Surgical Technology
267 123
148 182 206
-61 -22.8%
24 13.2%
Teaching Grades 1-5
107
206
N/A N/A
99 92.5%
Computer Aided Drafting & Design -CADD
85
63 101 134 200
115 135.3% 66 49.3%
Performance & Media Arts 200 118
134 176 189
-11 -5.5%
13 7.4%
Culinary Arts
215
117 162 174 182
-33 -15.3%
8
4.6%
Pharmacy Technician
276 114
128 153 182
-94 -34.1%
29 19.0%
Practical Nursing
214 119
146 138 169
-45 -21.0%
31 22.5%
Respiratory Care Technology
177 103
103 164 164
-13 -7.3%
0
0.0%
Fine Arts
157
90 111 134 160
3 1.9%
26 19.4%
Visual Communications
189 101
121 136 149
-40 -21.2%
13 9.6%
Emergency Medical Technology
178
98 124 129 142
-36 -20.2%
13 10.1%
Diagnostic Medical Sonography
115
80 117 116 141
26 22.6%
25 21.6%
Ranked
by Student Total
08/25/2009
23
Office of Institutional Research
Number
% Number
%
College Wide
Change
Change
Change
Change
2005 2005 2008 2008
2005 2006
2007 2008 2009
to 2009 to 2009 to 2009 to 2009
Medical Coding - Certificate
92 64
89 111 141
49 53.3%
30 27.0%
Electrical Electronics Engineering Technology 157
75 109 132 137
-20 -12.7%
5
3.8%
Motor Vehicle Technology
241 142
169 322 136
-105 -43.6%
-186 -57.8%
Computer Network Technology
204
131 105 107 132
-72 -35.3%
25 23.4%
Veterinary Technology
15 31
67 104 122
107 713.3%
18 17.3%
Interior Design
177 102
112 117 110
-67 -37.9%
-7 -6.0%
Music
133 53
74 82 103
-30 -22.6%
21 25.6%
CET-Architectural Engineering
120
90 91 115 102
-18 -15.0%
-13 -11.3%
Medical Laboratory Technician
167 79
92 94 101
-66 -39.5%
7
7.4%
Fire Protection Technology
178
68 93 91 97
-81 -45.5%
6
6.6%
Hospitality Management
82 50
57 69 80
-2 -2.4%
11 15.9%
Administrative Office Tech
137
85 78 82 75
-62 -45.3%
-7 -8.5%
CET-Construction Management
54
25 53 62 70
16 29.6%
8 12.9%
Funeral Service Education
169
95 91 78 70
-99 -58.6%
-8 -10.3%
Health Information Technology
152 81
69 73 68
-84 -55.3%
-5 -6.8%
Electrical Construction Technician
29
23 55 43 54
25 86.2%
11 25.6%
Occupational Therapy Assistant
62 28
40 48 53
-9 -14.5%
5 10.4%
Legal Secretary
68 36
34 38 52
-16 -23.5%
14 36.8%
Massage Therapy
34 30
43 44 46
12 35.3%
2 4.5%
CET-Civil Construction Technology
46
22 30 40 45
-1 -2.2%
5 12.5%
EST-Computer Repair Technology
54
22 27 31 44
-10 -18.5%
13 41.9%
Horticulture 48 35
37 41 41
-7 -14.6%
0
0.0%
Radiation Therapy (Certificate)
14 15
23 25 40
26 185.7%
15 60.0%
Dietetic Technician
60
27 32 34 37
-23 -38.3%
3
8.8%
Computer Repair (Certificate)
39
13 23 33 34
-5 -12.8%
1
3.0%
Website De eloper
7
23
33
N/A
N/A
10
43 5%
Spring Enrollment History 2005-2009 by Program
Ranked by Student Total (cont.)
Website Developer
7
23 33
N/A
N/A
10 43.5%
Safety & Health Technology
36 32
25 30 27
-9 -25.0%
-3 -10.0%
EST-Biomedical Equip Repair Technology
69
35 36 25 26
-43 -62.3%
1
4.0%
Nuclear Medicine Technology
46 28
33 25 25
-21 -45.7%
0
0.0%
American Sign Language Studies
39
18 24 24 21
-18 -46.2%
-3 -12.5%
Culinary Arts -Catering
4
21
N/A N/A
17 425.0%
Educational Interpreting for the Deaf
59
28 40 29 20
-39 -66.1%
-9 -31.0%
Pastry Art - Certificate
5 5
0
5 20
15 300.0%
15 300.0%
Entrepreneurship
1
15
N/A N/A
14 1400.0%
Ophthalmic Medical Assistant
13 4
5
19
12
-1 -7.7%
-7 -36.8%
EST-Electronics Repair Technology
16
4 0
0
1
-15 -93.8%
1
0.0%
Certified Nurse Assistant
1
0 0
0
0
-1 -100.0%
0
0.0%
Real Estate Agent
7
4
0
N/A N/A
-4 -100.0%
Welding Technology
0 0
0
0
0
0 0.0%
0 0.0%
Air Conditioning & Refrigeration
2
1
N/A N/A
N/A
N/A
Business Training
1
N/A N/A
N/A
N/A
Carpentry
4
1
1
N/A N/A
N/A
N/A
Construction Management Technology
8
3
N/A N/A
N/A
N/A
Dental Hygiene
6
4
2
N/A N/A
N/A
N/A
Dental Laboratory Technology
8
1
N/A N/A
N/A
N/A
Drafting (Certificate)
6
2
N/A N/A
N/A
N/A
Electronics Repair
4
1
N/A N/A
N/A
N/A
Food Service Careers
3
N/A N/A
N/A
N/A
IT- Machine Tool Technology
13 2
N/A N/A
N/A
N/A
Total
16,787 10,001 11,773 13,176 14,656
-2,131 -12.7%
1,480 11.2%
Spring Enrollment History 2005-2009 by Parish
08/25/2009
24
Office of Institutional Research
Number
% Number
%
College Wide
Change Change Change Change
2005 2005 2008 2008
2005 2006
2007 2008 2009
to 2009 to 2009 to 2009 to 2009
Orleans
6,357
2,362
3,076
3,447 3,958
-2,399 -37.7%
511 14.8%
Jefferson
5,925
4,382
4,819
5,271 5,856
-69 -1.2%
585 11.1%
St. Tammany
1,846
1,362
1,655
1,973 2,179
333 18.0%
206 10.4%
St. Charles
522
380
413
431 470
-52 -10.0%
39 9.0%
St. Bernard
281
166
196
192 214
-67 -23.8%
22 11.5%
St. John
353
266
273
287 278
-75 -21.2%
-9 -3.1%
Plaquemines
259
188
219
193 203
-56 -21.6%
10 5.2%
Terrebonne
177
118
103
112
89
-88 -49.7%
-23 -20.5%
Lafourche
139
95
116
112
99
-40 -28.8%
-13 -11.6%
St. James
66
49
44
42 39
-27 -40.9%
-3 -7.1%
Other
862
633
859
1,116
1,271
409 47.4%
155 13.9%
Total
16,787
10,001 11,773 13,176 14,656
-2,131 -12.7%
1,480 11.2%
0
1,000
2,000
3,000
4,000
5,000
6,000
7,000
College Wide Enrollment by Parish
Number
% Number
%
City Park
Change Change Change Change
2005 2005 2008 2008
2005 2006
2007 2008 2009
to 2009 to 2009 to 2009 to 2009
Orleans
5,333 1,644
2,252
2,701 3,101
-2,232 -41.9%
400 14.8%
Jefferson
3,649 2,581
2,830
3,286 3,624
-25 -0.7%
338 10.3%
St. Tammany
441 417
495
650 575
134 30.4%
-75 -11.5%
St. Charles
462 315
335
347 386
-76 -16.5%
39 11.2%
St. Bernard
208 102
129
140 158
-50 -24.0%
18 12.9%
St. John
332 242
248
259 239
-93 -28.0%
-20 -7.7%
Plaquemines
82 51
68
44 43
-39 -47.6%
-1 -2.3%
Terrebonne
156 98
80
92 70
-86 -55.1%
-22 -23.9%
Lafourche
123 84
95
89 69
-54 -43.9%
-20 -22.5%
St. James
63 45
37
37 24
-39 -61.9%
-13 -35.1%
Other
592 347
490
694 747
155 26.2%
53 7.6%
Total
11,441 5,926 7,059 8,339 9,036
-2,405 -21.0%
697 8.4%
Spring Enrollment History 2005-2009 by Parish
0
1,000
2,000
3,000
4,000
5,000
6,000
7,000
College Wide Enrollment by Parish
2005
2006
2007
2008
2009
08/25/2009
25
Office of Institutional Research
West Bank
Orleans
766
543
625 573 676
-90 -11.7%
103 18.0%
Jefferson
1,902
1,527
1,671 1,622 1,840
-62 -3.3%
218 13.4%
St. Tammany
11
20
38 34 34
23 209.1%
0 0.0%
St. Charles
36
41
39 43 52
16 44.4%
9 20.9%
St. Bernard
15
13
14
8
14
-1 -6.7%
6 75.0%
St. John
6
11
12
8
24
18 300.0%
16 200.0%
Plaquemines
163
118
132 138 147
-16 -9.8%
9
6.5%
Terrebonne
15
13
12 10 12
-3 -20.0%
2 20.0%
Lafourche
14
9
13
17 14
0
0.0%
-3 -17.6%
St. James
1
1
2 1 12
11 1100.0%
11 1100.0%
Other
82
73
97 122 149
67 81.7%
27 22.1%
Total
3,011 2,369 2,655 2,576 2,974
-37 -1.2%
398 15.5%
Charity School of Nursing
Orleans
243
153 184 158 150
-93 -38.3%
-8 -5.1%
Je
fferson
355
258 302 340 345
-10 -2.8%
5
1.5%
St. Tammany
127
113 130 111 126
-1 -0.8%
15 13.5%
St. Charles
22
22 37 40 29
7 31.8%
-11 -27.5%
St. Bernard
55
45 47 36 28
-27 -49.1%
-8 -22.2%
St. John
14
13 12 14 12
-2 -14.3%
-2 -14.3%
Plaquemines
14
18 19 9 12
-2 -14.3%
3 33.3%
Terrebonne
5
7 10
9
5
0
0.0%
-4 -44.4%
Lafourche
2
1
8 6 16
14 700.0%
10 166.7%
St. James
2
3 5
4
2
0
0.0%
-2 -50.0%
Other
31
25 33 29 45
14 45.2%
16 55.2%
Total
870 658 787 756 770
-100 -11.5%
14 1.9%
Spring Enrollment History 2005-2009 by Parish (cont.)
Slidell/Northshore
Orleans
15
22 15 15 31
16 106.7%
16 106.7%
Jefferson
19
16 16 23 47
28 147.4%
24 104.3%
St. Tammany
1,267
812 992 1178 1444
177 14.0%
266 22.6%
St. Charles
2
2 2
1
3
1 50.0%
2 200.0%
St. Bernard
3
6
6 8 14
11 366.7%
6 75.0%
St. John
1
0 1
3
3
2 200.0%
0 0.0%
Plaquemines
0
1 0
2
1
1
0.0%
-1 -50.0%
Tangipahoa
71
84 115 143 164
93 131.0%
21 14.7%
Terrebonne
1
0 1
1
2
1 100.0%
1 100.0%
Lafourche
0
1 0
0
0
0 0.0%
0 0.0%
St. James
0
0 0
0
1
1 0.0%
1 0.0%
Washington
58
76 81 82 100
42 72.4%
18 22.0%
Other
28
28 43 49 66
38 135.7%
17 34.7%
Total
1,465 1,048 1,272 1,505 1,876
411 28.1%
371 24.7%
08/25/2009
26
Office of Institutional Research
Number
% Number
%
College Wide
Change Change Change Change
2005 2005 2008 2008
2005 2006
2007 2008 2009
to 2009 to 2009 to 2009 to 2009
Alfred T Bonnabel
35 54 23 15 35
0 0.0%
20 133.3%
Amite High School
2 2 3 5 4
2 100.0%
-1 -20.0%
Archbishop Chapelle
3 18 5 4 4
1 33.3%
0 0.0%
Archbishop Rummel
8 20 8 10 12
4 50.0%
2 20.0%
Archbishop Shaw
6 30 2 6 7
1 16.7%
1 16.7%
Belle
Chasse
6
19
14 5 10
4 66.7%
5 100.0%
Bogalusa High School West
5 6 6 4 6
1 20.0%
2 50.0%
Booker T. Washington
19 2 8
4
8
-11 -57.9%
4 100.0%
Chalmette
4
4
6
4 10
6 150.0%
6 150.0%
Covington
15 27 12 14 17
2 13.3%
3 21.4%
Destrehan
16 36 13 9 12
-4 -25.0%
3 33.3%
East Jefferson
22 23 11 16 20
-2 -9.1%
4 25.0%
East Saint John
8 19 17 14 18
10 125.0%
4 28.6%
Ecole Classique
2 6 3 4 4
2 100.0%
0 0.0%
Slidell
6 12 9 3 13
7 116.7%
10 333.3%
F.T. Nicholls
13 0
3
4
5
-8 -61.5%
1 25.0%
Fisher Middle
1 17 3 4 4
3 300.0%
0 0.0%
Fountaineblueau
9 18 9 14 14
5 55.6%
0 0.0%
Edna Karr Magnet
14 4 3 3 8
-6 -42.9%
5 166.7%
George W. Carver Sr
20 1
9
4 10
-10 -50.0%
6 150.0%
Grace King
27 35 29 24 29
2 7.4%
5 20.8%
Hahnville
16 19 6 16 10
-6 -37.5%
-6 -37.5%
Hammond High
5 6 5 7 8
3 60.0%
1 14.3%
Helen Cox
0 0 0 8 16
16 0.0%
8 100.0%
HERITAGE ACADEMY
5
5
0
3
5
0 0.0%
2 66.7%
John Ehret
49 71 33 47 39
-10 -20.4%
-8 -17.0%
Spring Enrollment History 2005-2009 by Top "Feeder" High Schools
John F Kennedy Senior
38 8 13 11 10
-28 -73.7%
-1 -9.1%
John Mc Donogh Senior
39 6 12 19 32
-7 -17.9%
13 68.4%
JS Clark Senior
23 7 3 6 12
-11 -47.8%
6 100.0%
Kentwood
2 2 1 0 8
6 300.0%
8 0.0%
LB Landry
13 10 5 6 4
-9 -69.2%
-2 -33.3%
LE Rabouin Voc
21 11 13 9 20
-1 -4.8%
11 122.2%
LW Higgins
34 59 36 22 36
2 5.9%
14 63.6%
Mandeville
7 7 13 9 9
2 28.6%
0 0.0%
Marion Abramson
30 15 15 12 14
-16 -53.3%
2 16.7%
Mc Donogh 35 Senior
15 13 16 8 10
-5 -33.3%
2 25.0%
Mc Main Magnet
3 7 6 10 8
5 166.7%
-2 -20.0%
Northshore
11 28 9 13 8
-3 -27.3%
-5 -38.5%
O Perry Walker Senior
25 36 10 12 23
-2 -8.0%
11 91.7%
Pearl River
3 7 3 5 7
4 133.3%
2 40.0%
Ponchatoula High
4 6 5 5 5
1 25.0%
0 0.0%
Riverdale
14
17
17 17 24
10 71.4%
7 41.2%
Salmen
8 19 9 5 13
5 62.5%
8 160.0%
Sarah Reed
32 9 9 8 20
-12 -37.5%
12 150.0%
Slidell
17
40
17 26 17
0
0.0%
-9 -34.6%
St Augustine
12 5 4 7 6
-6 -50.0%
-1 -14.3%
Fisher Middle
17 9 8 2 6
-11 -64.7%
4 200.0%
Warren Easton Fundamental
23 14 11 16 21
-2 -8.7%
5 31.3%
West Jefferson
48 64 42 35 37
-11 -22.9%
2
5.7%
Lb Landry
1 1 1 1 4
3 300.0%
3 300.0%
Unknown
130
71
63 49 51
-79 -60.8%
2
4.1%
G.E.D.
260
200
160 182
245
-15 -5.8%
63 34.6%
Non-High School Grads
13
1
93 81 85
72 553.8%
4 4.9%
Other
272 425
239 250 338
66 24.3%
88 35.2%
TOTAL First Time Freshman
1,431 1,551 1,073 1,077 1,401
-30 -2.1%
324 30.1%
08/25/2009
27
Office of Institutional Research
Number
%
Number
%
College Wide
Change Change Change Change
Zip
2005 2005 2008 2008
Code
2005
2006 2007 2008 2009
to 2009 to 2009 to 2009 to 2009
Metairie S of I-10 70001
546
357 466 472 522
-24 -4.4%
50 10.6%
Metairie 70002
257
141 168 205 252
-5 -1.9%
47 22.9%
West Metairie 70003
559
354 443 506 576
17 3.0%
70 13.8%
Old Metairie-Bucktown 70005
229
180 213 229 268
39 17.0%
39 17.0%
Metairie Clearview N of I-10 70006
197
124 145 174 202
5
2.5% 28 16.1%
Belle Chasse 70037
191
147 171 164 171
-20 -10.5%
7
4.3%
Chalmette 70043
143
45 50 65 80
-63 -44.1%
15 23.1%
Destrehan 70047
149
103 128 124 143
-6 -4.0%
19 15.3%
Gretna 70053
213
171 182 177 643
430 201.9%
466 263.3%
Gretna/S of Whitney 70056
648
446 529 565 643
-5 -0.8%
78 13.8%
Harvey 70058
725
555 576 658 666
-59 -8.1%
8
1.2%
South Kenner 70062
235
180 190 219 220
-15 -6.4%
1
0.5%
North Kenner 70065
714
559 646 699 798
84 11.8%
99 14.2%
LaPlace 70068
282
204 252 282 262
-20 -7.1%
-20 -7.1%
Marrero 70072
833
739 767 814 873
40 4.8%
59 7.2%
Westwego 70094
420
348 390 431 498
78 18.6%
67 15.5%
Algiers
70114
448
290 332 327 315
-133 -29.7%
-12 -3.7%
Uptown 70115
324
137 220 222 256
-68 -21.0%
34 15.3%
French Quarter-Marigny 70116
155
57 100 94 101
-54 -34.8%
7
7.4%
Bywater/ Lower 9th Ward 70117
649
120 143 180 235
-414 -63.8%
55 30.6%
Carrollton/Riverbend 70118
403
140 184 255 260
-143 -35.5%
5
2.0%
Mid City
70119
646
167 229 295 398
-248 -38.4%
103 34.9%
N.O. Postal Box Zone 70121
150
120 136 133 140
-10 -6.7%
7
5.3%
Lakefront/Gentilly 70122
627
109 169 258 338
-289 -46.1%
80 31.0%
Harahan-Jefferson 70123
282
222 247 277 297
15 5.3%
20 7.2%
Lakefront/Lakeview 70124
211
57 60 104 176
-35 -16.6%
72 69.2%
Broadmoor 70125
233
41 82 115 132
-101 -43.3%
17 14.8%
N.O. East Crowder 70126
627
67 86 155 269
-358 -57.1%
114 73.5%
Spring Enrollment History 2004-2008 by Zip Code (zip code order)
N
.O. East Crowder
70126
627
67
86
155
269
358
57.1%
114
73.5%
N.O. East Crowder to Wright Rd 70127
462
85 125 198 252
-210 -45.5%
54 27.3%
N.O. East Wright Rd to I-510 70128
359
64 106 194 266
-93 -25.9%
72 37.1%
N.O. East Past I-510 70129
265
63 103 157 174
-91 -34.3%
17 10.8%
N.O. CBD Lower Garden District 70130
131
72 100 92 98
-33 -25.2%
6
6.5%
Lower Coast Algiers 70131
445
333 383 385 422
-23 -5.2%
37 9.6%
Slidell 70458
417
262 338 384 416
-1 -0.2%
32 8.3%
Slidell 70460
298
193 225 283 297
-1 -0.3%
14 4.9%
Slidell 70461
336
207 306 341 356
20 6.0%
15 4.4%
Subtotal
13,809 7,459 8,990 10,233 12,015
-1,794 -13.0%
1,782 17.4%
Other Louisiana
2,899 2,311 2,613 2,856 2,551
-348 -12.0%
-305 -10.7%
Total Louisiana
16,708 9,770 11,603 13,089 14,566
-2,142 -12.8%
1,477 11.3%
Out-of-State/Unknown
79 231 181 87 90
11 13.9%
3 3.4%
Total
16,787 10,001 11,784 13,176 14,656
-2,131 -12.7%
1,480 11.2%
08/25/2009
28
Office of Institutional Research
Number
%
Number
%
City Park
Change Change Change Change
Zip
2005 2005 2008 2008
Code
2005
2006 2007 2008 2009
to 2009 to 2009 to 2009 to 2009
Metairie S of I-10 70001 491
314 410 416 460
-31 -6.3%
44 10.6%
Metairie 70002 231
129 154 188 230
-1 -0.4%
42 22.3%
West Metairie 70003 500
320 395 462 524
24 4.8%
62 13.4%
Old Metairie-Bucktown 70005 204
158 182 205 234
30 14.7%
29 14.1%
Metairie Clearview N of I-10 70006 186
117 132 156 181
-5 -2.7%
25 16.0%
Belle Chasse 70037 53
40 45 38 37
-16 -30.2%
-1 -2.6%
Chalmette 70043 104
33 34 52 60
-44 -42.3%
8
15.4%
Destrehan
70047 141
86 110 108 121
-20 -14.2%
13 12.0%
Gretna 70053 57
54 53 74 65
8 14.0%
-9 -12.2%
Gretna/S of Whitney 70056 219
144 181 214 237
18 8.2%
23 10.7%
Harvey
70058 219
173 183 255 226
7
3.2%
-29 -11.4%
South Kenner 70062 221
168 171 198 195
-26 -11.8%
-3 -1.5%
North Kenner 70065 653
496 584 636 195
-458 -70.1%
-441 -69.3%
LaPlace 70068 266
204 226 254 226
-40 -15.0%
-28 -11.0%
Marrero 70072 255
233 193 247 263
8
3.1% 16
6.5%
Westwego 70094 164
131 135 187 168
4
2.4%
-19 -10.2%
Algiers
70114 128
86 110 110 96
-32 -25.0%
-14 -12.7%
Uptown 70115 296
116 197 194 219
-77 -26.0%
25 12.9%
French Quarter-Marigny 70116 144
50 87 87 91
-53 -36.8%
4
4.6%
Bywater/ Lower 9th Ward 70117 608
107 127 162 216
-392 -64.5%
54 33.3%
Carrollton/Riverbend 70118 383
121 172 235 239
-144 -37.6%
4
1.7%
Mid City
70119 618
151 202 275 363
-255 -41.3%
88 32.0%
N.O. Postal Box Zone 70121 128
105 117 121 126
-2 -1.6%
5
4.1%
Lakefront/Gentilly 70122 585
89 154 240 311
-274 -46.8%
71 29.6%
Harahan-Jefferson 70123 251
188 210 236 253
2
0.8% 17
7.2%
Lakefront/Lakeview 70124 191
51 53 91 161
-30 -15.7%
70 76.9%
Broadmoor 70125 222
35 71 108 119
-103 -46.4%
11 10.2%
N.O. East Crowder 70126 591
57 72 140 244
-347 -58.7%
104 74.3%
Spring Enrollment History 2004-2008 Zip Code by Campus (zip code order)
N.O. East Crowder to Wright Rd 70127 435
70 103 180 223
-212 -48.7%
43 23.9%
N.O. East Wright Rd to I-510 70128 330
54 95 183 245
-85 -25.8%
62 33.9%
N.O. East Past I-510 70129 242
54 91 144 154
-88 -36.4%
10 6.9%
N.O. CBD Lower Garden District 70130 116
62 87 80 79
-37 -31.9%
-1 -1.3%
Lower Coast Algiers 70131 163
109 106 124 164
1
0.6% 40 32.3%
Slidell
70458 104
82 110 145 111
7
6.7%
-34 -23.4%
Slidell
70460 78
66 66 85 69
-9 -11.5%
-16 -18.8%
Slidell
70461 83
72 103 122 120
37 44.6%
-2 -1.6%
Subtotal 9,660 4,525 5,521 6,752 7,025
-2,635 -27.3%
273 4.0%
Other Louisiana 1,720 1,241 1,425 1,522 1,949 229 13.3% 427 28.1%
Total Louisiana 11,380 5,766 6,946 8,274 8,974
-2,406 -21.1%
700 8.5%
Out-of-State/Unknown 61 160 113 65 62 1 1.6%
-3 -4.6%
Total
11,441 5,926 7,059 8,339 9,036
-2,405 -21.0%
697 8.4%
08/25/2009
29
Office of Institutional Research
Number
%
Number
%
West Bank
Change Change Change Change
Zip
2005 2005 2008 2008
Code
2005
2006 2007 2008 2009
to 2009 to 2009 to 2009 to 2009
Metairie S of I-10 70001 13
18 19 17 26
13 100.0%
9 52.9%
Metairie
70002 7
5 8 11 15
8 0.0%
4 36.4%
West Metairie 70003 11
10 23 13 12
1
9.1%
-1 -7.7%
Old Metairie-Bucktown 70005 13
8
15 6
11
-2 0.0%
5
83.3%
Metairie Clearview N of I-10 70006 2
3
5
5
7
5 250.0%
2 40.0%
Belle Chasse 70037 130
96 114 116 121
-9 -6.9%
5
4.3%
Chalmette 70043 7
1
2
3
6
-1 -14.3%
3
100.0%
Destrehan 70047 2
8
8
7
8
6 300.0%
1 14.3%
Gretna
70053 144
106 122 96 96
-48 -33.3%
0
0.0%
Gretna/S of Whitney 70056 400
271 319 318 373
-27 -6.8%
55 17.3%
Harvey 70058 462
344 358 365 407
-55 -11.9%
42 11.5%
South Kenner 70062 10
5
11 6
13
3 0.0%
7 116.7%
North Kenner 70065 12
15 15 19 35
23 191.7%
16 84.2%
Jean Lafitte
70067 41
22 20 25 21
-20 -48.8%
-4 -16.0%
LaPlace 70068 7
7
7
4 18
11 157.1%
14 350.0%
Marrero 70072 535
475 525 512 553
18 3.4%
41 8.0%
Plaquemines
70083 28
16 14 28 28
0
0.0% 0
0.0%
Westwego 70094 238
199 230 218 300
62 26.1%
82 37.6%
Algiers
70114 303
195 212 207 206
-97 -32.0%
-1 -0.5%
Uptown 70115 10
13 15 20 25
15 150.0%
5 25.0%
French Quarter-Marigny 70116 6
2
6
3
7
1 16.7%
4 133.3%
Bywater/ Lower 9th Ward 70117 21
7
12
11
13
-8 -38.1%
2
18.2%
Carrollton/Riverbend 70118 12
14 6
11
14
2 16.7%
3 27.3%
Mid City
70119 9
6
11
10
18
9 100.0%
8 80.0%
N.O. Postal Box Zone 70121 6
9 10
5
7
1 16.7%
2 40.0%
Lakefront/Gentilly 70122 17
10
6
7 13
-4 -23.5%
6
85.7%
Harahan-Jefferson 70123 12
11 11 16 18
6 50.0%
2 12.5%
Lakefront/Lakeview 70124 2
1
3
4
4
2
0.0% 0
0.0%
Spring Enrollment History 2004-2008 Zip Code by Campus (zip code order)
Broadmoor 70125 6
6
6
3
6
0 0.0%
3 100.0%
N.O. East Crowder 70126 17
5
7
9 20
3 17.6%
11 122.2%
N.O. East Crowder to Wright Rd 70127 9
8
13 9
21
12 133.3%
12 133.3%
N.O. East Wright Rd to I-510 70128 12
4
2
3 10
-2 -16.7%
7
233.3%
N.O. East Past I-510 70129 13
7 6 10 10
-3 -23.1%
0 0.0%
N.O. CBD Lower Garden District 70130 7
8
11 6
13
6 85.7%
7 116.7%
Lower Coast Algiers 70131 263
209 255 243 237
-26 -9.9%
-6 -2.5%
Slidell
70458 1
2
8
5
7
6 600.0%
2 40.0%
Slidell
70460 2
4
4
4
4
2
0.0% 0
0.0%
Slidell
70461 1
2
7
6
6
5
0.0% 0
0.0%
Subtotal
2,791 2,132 2,426 2,361 2,709
-82 -2.9%
348 14.7%
Other Louisiana
216 204 206 203 248 32 14.8%
45 22.2%
Total Louisiana
3,007 2,336 2,632 2,564 2,957
-50 -1.7%
393 15.3%
Out-of-State/Unknown
4 33 23 12 17 13 0.0%
5 41.7%
Total
3,011 2,369 2,655 2,576 2,974
-37 -1.2%
398 15.5%
08/25/2009
30
Office of Institutional Research
Number
%
Number
%
Charity School of Nursing
Change Change Change Change
Zip
2005 2005 2008 2008
Code
2005
2006 2007 2008 2009
to 2009 to 2009 to 2009 to 2009
Metairie S of I-10 70001 42
23 35 35 29
-13 -31.0%
-6 -17.1%
Metairie
70002 17
7
6
5
6
-11 -64.7%
1
20.0%
West Metairie 70003 46
23 24 30 36
-10 -21.7%
6
20.0%
Old Metairie-Bucktown 70005 12
13 16 17 21
9 75.0%
4 23.5%
Metairie Clearview N of I-10 70006 9
4 7 13 13
4 44.4%
0 0.0%
Belle Chasse 70037 8
11 12 10 12
4 50.0%
2 20.0%
Chalmette 70043 32
9
14 9
11
-21 -65.6%
2
22.2%
Destrehan
70047 6
9
10 9
14
8 133.3%
5 55.6%
Gretna
70053 12
11
6
7
6
-6 -50.0%
-1 -14.3%
Gretna/S of Whitney 70056 28
29 28 33 32
4 14.3%
-1 -3.0%
Harvey 70058 42
36 35 37 30
-12 -28.6%
-7 -18.9%
South Kenner 70062 4
7 8 15 11
7 175.0%
-4 -26.7%
North Kenner 70065 47
47 47 43 43
-4 -8.5%
0
0.0%
LaPlace 70068 8
9
18
22
16
8 100.0%
-6 -27.3%
Marrero 70072 41
30 48 54 51
10 24.4%
-3 -5.6%
Westwego 70094 18
18 25 26 30
12 66.7%
4 15.4%
Algiers
70114 17
8
10
10
13
-4 -23.5%
3
30.0%
Uptown 70115 18
8
6
8
9
-9 -50.0%
1
12.5%
French Quarter-Marigny 70116 5
5
7
4
4
-1 -20.0%
0
0.0%
Bywater/ Lower 9th Ward 70117 19
5
4
6
5
-14 -73.7%
-1 -16.7%
Carrollton/Riverbend 70118 8
5
6
8
6
-2 -25.0%
-2 -25.0%
Mid City
70119 19
9
16
10
17
-2 -10.5%
7
70.0%
N.O. Postal Box Zone 70121 15
6
9
7
7
-8 -53.3%
0
0.0%
Lakefront/Gentilly 70122 23
9 9 10 12
-11 -47.8%
2
20.0%
Harahan-Jefferson 70123 18
23 26 25 24
6 33.3%
-1 -4.0%
Lakefront/Lakeview 70124 18
4
4
9 11
-7 -38.9%
2
22.2%
Broadmoor 70125 5
0
5
4
5
0
0.0% 1
0.0%
N.O. East Crowder 70126 18
4
7
5
3
-15 -83.3%
-2 -40.0%
Spring Enrollment History 2004-2008 Zip Code by Campus (zip code order)
N.O. East Crowder to Wright Rd 70127 17
6
9
8
7
-10 -58.8%
-1 -12.5%
N.O. East Wright Rd to I-510 70128 17
4
8
7
7
-10 -58.8%
0
0.0%
N.O. East Past I-510 70129 6
2
3
2
9
3 50.0%
7 350.0%
N.O. CBD Lower Garden District 70130 7
2
1
4
5
-2 -28.6%
1
25.0%
Lower Coast Algiers 70131 18
13 22 18 21
3 16.7%
3 16.7%
Slidell
70458 1
21 28 22 33
32 3200.0%
11 50.0%
Slidell
70460 2
21 21 27 19
17 850.0%
-8 -29.6%
Slidell 70461 1
16 25 15 21
20 2000.0%
6 40.0%
Subtotal
624 457 565 574 599
-25 -4.0%
25 4.4%
Other Louisiana
238 179 209 179 169 -69 -29.0%
-10 -5.6%
Total Louisiana
862 636 774 753 768
-94 -10.9%
15 2.0%
Out-of-State/Unknown
8 22 13 3 2
-6 -75.0%
-1 -33.3%
Total
870 658 787 756 770
-100 -11.5%
14 1.9%
08/25/2009
31
Office of Institutional Research
Number
%
Number
%
Slidell/Northshore
Change Change Change Change
Zip
2005 2005 2008 2008
Code
2005
2006 2007 2008 2009
to 2009 to 2009 to 2009 to 2009
Metairie S of I-10 70001 0
2
2
4
7
7 0.0%
3 75.0%
Metairie
70002 2
0
0
1
1
-1 0.0%
0
0.0%
West Metairie 70003 2
1
1
1
4
2 100.0%
3 300.0%
Old Metairie-Bucktown 70005 0
1
0
1
2
2
0.0% 1
0.0%
Metairie Clearview N of I-10 70006 0
0
1
0
1
1
0.0% 1
0.0%
Belle Chasse 70037 0 0 0
0
1
1
0.0% 1
0.0%
Chalmette 70043 0
2
0
1
3
3
0.0% 2
0.0%
Destrehan
70047 0
0
0
0
0
0
0.0% 0
0.0%
Gretna
70053 0
0
1
0
0
0
0.0% 0
0.0%
Gretna/S of Whitney 70056 0
2
1
0
1
1
0.0% 1
0.0%
Harvey
70058 0
2
0
1
3
3
0.0% 2
0.0%
South Kenner 70062 0
0
0
0
1
1
0.0% 1
0.0%
North Kenner 70065 2
1
0
1
1
-1 -50.0%
0
0.0%
LaPlace 70068 1
0
1
2
2
1 100.0%
0 0.0%
Marrero 70072 2
1
1
1
6
4 200.0%
5 500.0%
Westwego 70094 0
0
0
0
0
0
0.0% 0
0.0%
Algiers
70114 0
1
0
0
0
0
0.0% 0
0.0%
Uptown 70115 0 0 0
0
3
3
0.0% 3
0.0%
French
Quarter-Marigny
70116 0
0
0
0
1 1 0.0% 1 0.0%
Bywater/ Lower 9th Ward 70117 1
1
0
1
1
0
0.0% 0
0.0%
Carrollton/Riverbend 70118 0 0 0
1
1
1
0.0% 0
0.0%
Mid City
70119 0
1
0
0
0
0
0.0% 0
0.0%
N.O. Postal Box Zone 70121 1
0
0
0
0
-1 0.0%
0
0.0%
Lakefront/Gentilly 70122 2
1
0
1
2
0
0.0% 1
0.0%
Harahan-Jefferson 70123 1
0
0
0
2
1 100.0%
2 0.0%
Lakefront/Lakeview 70124 0
1
0
0
0
0
0.0% 0
0.0%
Broadmoor 70125
0
0
0
0
2 2 0.0% 2 0.0%
N.O. East Crowder 70126 1
1
0
1
2
1 100.0%
1 0.0%
Spring Enrollment History 2004-2008 Zip Code by Campus (zip code order)
N.O. East Crowder to Wright Rd 70127 1
1
0
1
1
0
0.0% 0
0.0%
N.O. East Wright Rd to I-510 70128 0
2
1
1
3
3
0.0% 2
0.0%
N.O. East Past I-510 70129 4
0
3
1
1
-3 -75.0%
0
0.0%
N.O. CBD Lower Garden District 70130 1
0
1
2
1
0
0.0%
-1 0.0%
Lower Coast Algiers 70131 1
2
0
0
0
-1 0.0%
0
0.0%
St. Tammany 70420 36
30 32 45 58
22 61.1%
13 28.9%
Washington
70427 27
34 35 33 42
15 55.6%
9 27.3%
Covington
70433 112
94 106 130 167
55 49.1%
37 28.5%
Covington
70435 48
40 47 81 91
43 89.6%
10 12.3%
St. Tammany
70445 57
33 55 64 73
16 28.1%
9 14.1%
St. Tammany
70448 56
62 70 88 108
52 92.9%
20 22.7%
St. Tammany
70452 72
46 59 87 77
5
6.9%
-10 -11.5%
Slidell
70458 282
157 192 212 265
-17 -6.0%
53 25.0%
Slidell 70460 199
102 134 167 205
6
3.0% 38 22.8%
Slidell
70461 230
117 171 198 209
-21 -9.1%
11 5.6%
St. Tammany 70471 70
53 71 60 91
21 30.0%
31 51.7%
Subtotal
1,211 791 985 1,187 1,439 228 18.8%
252 21.2%
Other Louisiana
248 241 271 311 428 180 72.6%
117 37.6%
Total Louisiana
1,459 1,032 1,256 1,498 1,867 408 28.0%
369 24.6%
Out-of-State/Unknown
6 16 16 7 9 3 50.0%
2 28.6%
Total
1,465 1,048 1,272 1,505 1,876 828 79.0%
371 24.7%
08/25/2009
32
Office of Institutional Research