Fall 2009 Cohort
Office
of
Institutional
Research
First time,
full time
associate degree seeking
students
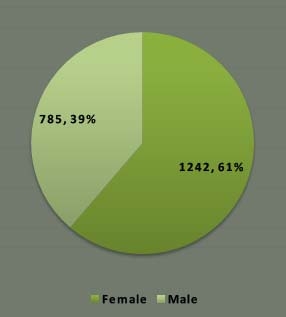
2,027
Gender
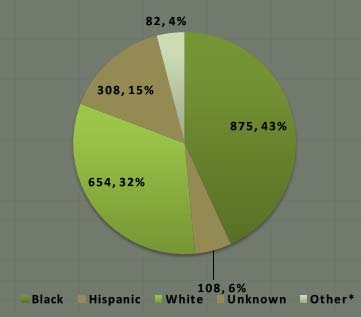
Ethnicity
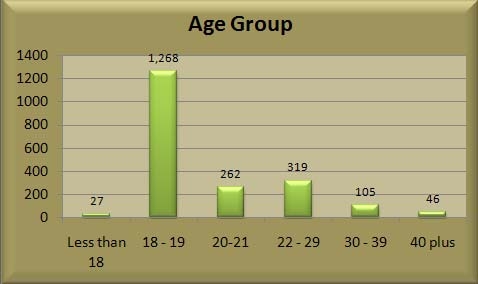
Student Demographics
Student Demographics
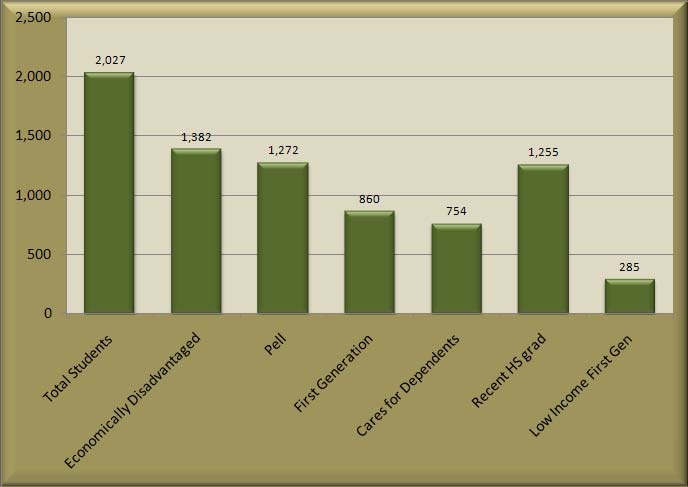
Special Populations
Student Demographics
85 % are in at least 1 developmental class, 25% are in 3 or more
Developmental Status
Almost 60% are in READ 072
75% are in the highest level
Reading
English
Reading
English
Developmental Level
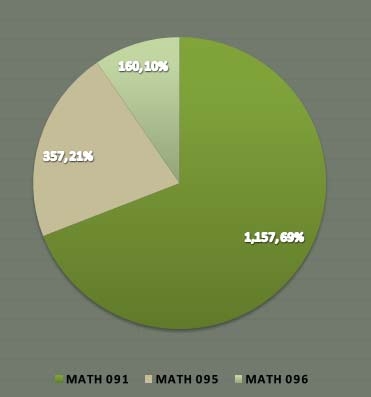
Math - Almost 70% are in 091
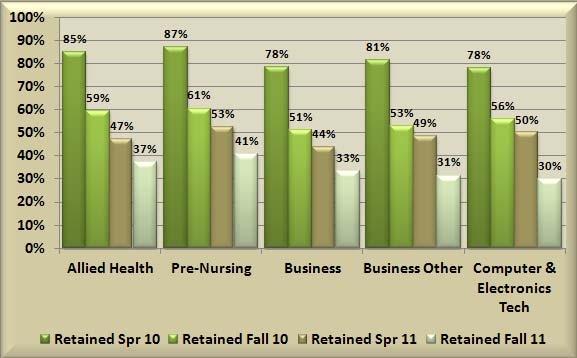
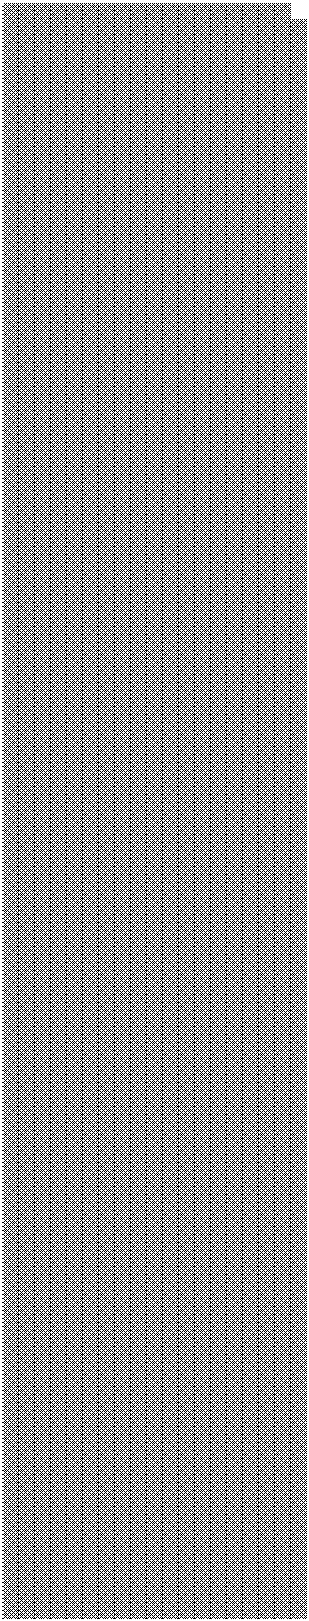
Fall 2009 to Spring 2010: 83.1%
Fall 2009 to Fall 2010: 56.4%
Fall 2009 to Spring 2011: 47.1%
Fall 2009 to Fall 2011: 37.2%
¾
886 students
(44%) in the cohort
took a
Developmental
English class
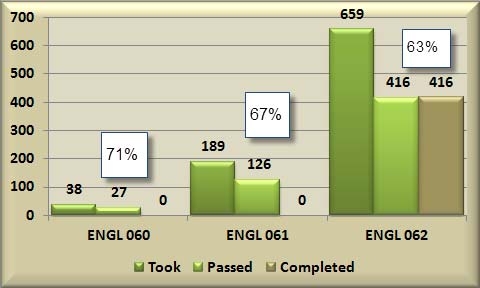
¾
At the end of the
semester 47% of the
886 completed the
Developmental
English sequence
¾
153 of 227 (68%)
moved to the next
level.
¾
751 (85%) developmental
English students returned
for the Spring 2010 term.
¾
331 (42%) of them are
still in the tract.
¾
At the end of the
semester, 115 of the 331
(35%) completed the tract.
¾
A total of 471(53%) of the
beginning cohort
completed Developmental
English
¾
Of the 156 students
who repeated English
062, only 35% passed.
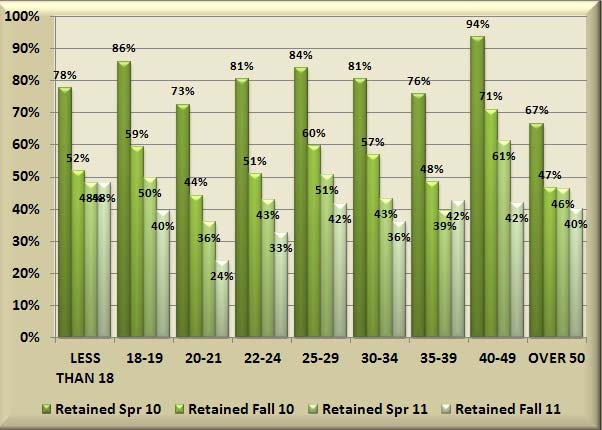
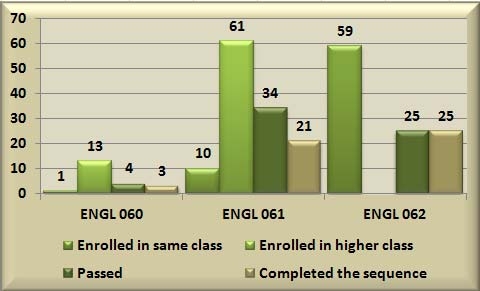
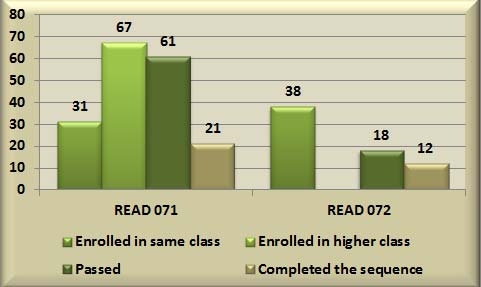
The bars on this chart represent students still in
the developmental English sequence
¾
509 (57%) developmental
English students returned
for the Fall 2010 term.
¾
144 (16%) of them are
still in the tract.
¾
At the end of the
semester, 46 of the 144
(32%) completed the tract.
¾
A total of 517(58%) of the
beginning cohort
completed Developmental
English
¾
70 students are still
enrolled in their first
developmental English
class
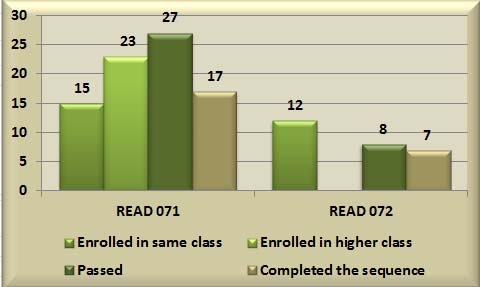
The bars on this chart represent students still
in the developmental English sequence
¾
419 (47%)
developmental English
students returned for
the Spring 2011 term.
¾
54 (13%) are still in
the developmental
sequence.
¾
At the end of the
semester, 4 of the 54
(7%) completed the
developmental
sequence.
¾
A total of 521(59%)
of the beginning
cohort completed
Developmental English
The bars on this chart represent students
still in the developmental English sequence
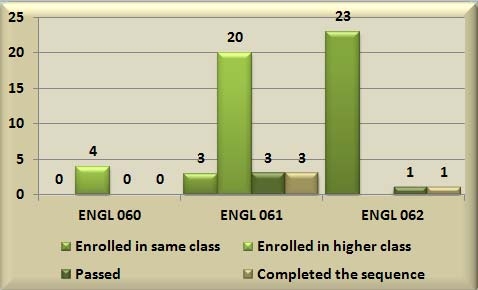
¾
641 students
(32%) in the cohort
took a
Developmental
Reading class
¾
At the end of the
semester 56% of
the 641 completed
the Developmental
Reading sequence
¾
152 of 641 (24%)
moved to the next
level.
¾
69 students
(10%) in the cohort
retook the same
Developmental
Reading class
¾
At the end of the
2nd semester 61%
of the 641
completed the
Developmental
Reading sequence
¾
79 of 641 (12%)
made progress
The bars on this chart represent students still in the
developmental Reading sequence
¾
27 students (4%)
in the cohort
retook the same
Developmental
Reading class
taken their first
semester.
¾
At the end of the
3rd semester 65%
of the 641
completed the
Developmental
Reading sequence
¾
35 of the 50
(70%) still in
Developmental
Reading made
progress
The bars on this chart represent students still in the
developmental Reading sequence
¾
14 (1%) students
are still in the
developmental
Reading sequence
¾
10 students (1%)
in the cohort retook
the same
developmental
Reading class taken
their first semester.
¾
At the end of the
4th semester 1
additional student
completed the
developmental
Reading sequence
The bars on this chart represent students still in
the developmental Reading sequence
¾
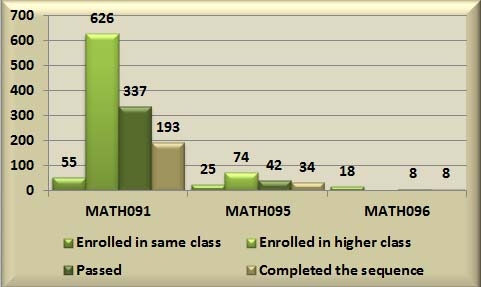
1674 students
(83%) of the
cohort enrolled
Developmental
Math
¾
At the end of the
semester 101 (6%)
of the 1674 had
completed the
Developmental
Math sequence
¾
987 of 1674
(59%) moved to
the next level.
¾
310 of 1674
students (18%)
enrolled in the
same
Developmental
Math class
¾
At the end of the
2nd semester 250
(15%) of the 1674
had completed the
Developmental
Math sequence
¾
942 of 1674
(56%) took to the
next class.
The bars on this chart represent students still in the
developmental Math sequence
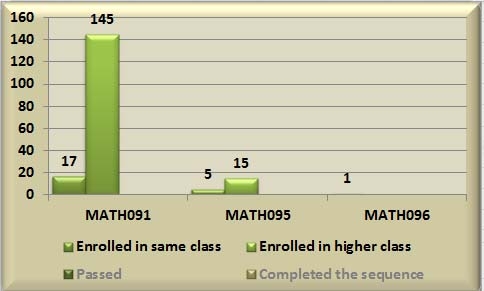
¾
798 of 1674 (47%)
are still taking
Developmental Math.
¾
98 of 1674 students
(6%) are still enrolling
in the same
Developmental Math
class from their 1st
semester.
¾
At the end of the 3rd
semester only 485
(29%) of the 1674 had
completed the
Developmental Math
sequence.
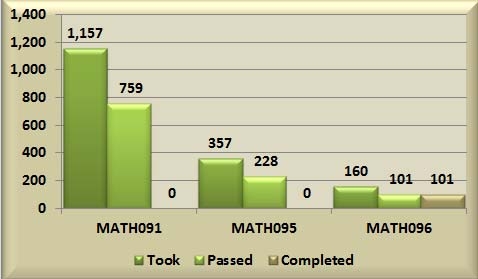
The bars on this chart represent students still in
the developmental Math sequence
¾
183 of 1674 (11%)
are still taking
Developmental Math.
¾
23 of 1674 students
(1%) are still enrolling
in the same
Developmental Math
class from their 1st
semester.
¾
None passed or
completed.
¾
At the end of the 4th
semester only 485
(29%) of the 1674 had
completed the
Developmental Math
sequence.
The bars on this chart represent students still in the
developmental Math sequence
`
2,027 first-time, full-time, associate degree seeking
students
`
954 (47%) are still enrolled, of which 809 (85%)
started in developmental, & 366 (38%) are still taking
developmental classes
`
20 (2%) are enrolled in a Limited Admission Program
`
57 need to graduate in AC 1112 to meet our targeted
GRS of 2.8%
`
Of the 954 still enrolled:
`
339 (35 %) have become part-time
`
369 ( 39% ) are still taking developmental classes
`
378 ( 40% ) are first generation
`
214 (22%) have a GPA < 2.0
`
159 (17%) not in Good Standing
`
2,027 first-time, full-time, associate degree seeking
students
`
754 (37%) are still enrolled
`
35 (5%) are taking classes in a limited admission
program
`
222 (11%) have transferred to a 4 year institution
`
4 have graduated
`
57 need to graduate in AC 1112 to meet our targeted
GRS of 2.8%
`
Of the 754 still enrolled:
`
332 (44 %) have become part-time
`
366 ( 48% ) are still taking developmental classes
`
304 ( 40% ) are first generation