| A | B | C | D | E | F | G | H | I | J | K | L | M | N | O | P | Q | |
|---|---|---|---|---|---|---|---|---|---|---|---|---|---|---|---|---|---|
| 1 | |||||||||||||||||
| 2 |

|
||||||||||||||||
| 3 | |||||||||||||||||
| 4 | |||||||||||||||||
| 5 | Office of Planning & Research | ||||||||||||||||
| 6 |

|
||||||||||||||||
| 7 | |||||||||||||||||
| 8 | |||||||||||||||||
| 9 | End of Semester Enrollment Report | ||||||||||||||||
| 10 | |||||||||||||||||
| 11 | Spring 2017 | ||||||||||||||||
| 12 | |||||||||||||||||
| 13 | |||||||||||||||||
| 14 | |||||||||||||||||
| 15 | |||||||||||||||||
| 16 | |||||||||||||||||
| 17 |

|
||||||||||||||||
| 18 | |||||||||||||||||
| 19 | |||||||||||||||||
| 20 | |||||||||||||||||
| 21 | |||||||||||||||||
| 22 | |||||||||||||||||
| 23 | |||||||||||||||||
| 24 | |||||||||||||||||
| 25 | |||||||||||||||||
| 26 | |||||||||||||||||
| 27 | |||||||||||||||||
| 28 | |||||||||||||||||
| 29 | |||||||||||||||||
| 30 | |||||||||||||||||
| 31 | |||||||||||||||||
| 32 | |||||||||||||||||
| 33 | |||||||||||||||||
| 34 | |||||||||||||||||
| 35 | |||||||||||||||||
| 36 | |||||||||||||||||
| 37 | |||||||||||||||||
| 38 | |||||||||||||||||
| 39 | |||||||||||||||||
| 40 | |||||||||||||||||
| 41 | |||||||||||||||||
| 42 | |||||||||||||||||
| 43 | |||||||||||||||||
| 44 | |||||||||||||||||
| 45 | |||||||||||||||||
| 46 | |||||||||||||||||
| 47 | |||||||||||||||||
| 48 | Prepared by the Office of Planning & Research | ||||||||||||||||
| 49 | 7/25/2017 | ||||||||||||||||
| 50 | |||||||||||||||||
| 51 | |||||||||||||||||
|---|---|---|---|---|---|---|---|---|---|---|---|---|---|---|---|---|---|
| 52 | |||||||||||||||||
| 53 | |||||||||||||||||
| 54 | |||||||||||||||||
| 55 | |||||||||||||||||
| 56 | |||||||||||||||||
| 57 | |||||||||||||||||
| 58 | |||||||||||||||||
| 59 | |||||||||||||||||
| 60 | Table of Contents | Page no. | |||||||||||||||
| 61 | |||||||||||||||||
| 62 | |||||||||||||||||
| 63 | |||||||||||||||||
| 64 | Summary | 1 | |||||||||||||||
| 65 | |||||||||||||||||
| 66 | Enrollment by Gender | 2 | |||||||||||||||
| 67 | |||||||||||||||||
| 68 | Enrollment by Ethnicity | 3 | |||||||||||||||
| 69 | |||||||||||||||||
| 70 | Enrollment by Age | 5 | |||||||||||||||
| 71 | |||||||||||||||||
| 72 | Enrollment by Admission Status | 8 | |||||||||||||||
| 73 | |||||||||||||||||
| 74 | Enrollment by Classification | 11 | |||||||||||||||
| 75 | |||||||||||||||||
| 76 | Full-time/Part-time Status, Headcount, FTE, SCH | 12 | |||||||||||||||
| 77 | |||||||||||||||||
| 78 | Enrollment by Award Sought | 14 | |||||||||||||||
| 79 | |||||||||||||||||
| 80 | Enrollment by Division | 16 | |||||||||||||||
| 81 | |||||||||||||||||
| 82 | Enrollment by Course Location, SCH | 16 | |||||||||||||||
| 83 | |||||||||||||||||
| 84 | Enrollment by Online Status | 17 | |||||||||||||||
| 85 | |||||||||||||||||
| 86 | Enrollment by Program | 18 | |||||||||||||||
| 87 | |||||||||||||||||
| 88 | Enrollment by Major Ranked | 20 | |||||||||||||||
| 89 | |||||||||||||||||
| 90 | Enrollment by Parish | 21 | |||||||||||||||
| 91 | |||||||||||||||||
| 92 | Enrollment by Zip Code | 24 | |||||||||||||||
| 93 | |||||||||||||||||
| 94 | |||||||||||||||||
| 95 | |||||||||||||||||
| 96 | |||||||||||||||||
| 97 | |||||||||||||||||
| 98 | |||||||||||||||||
| 99 | |||||||||||||||||
| 100 | |||||||||||||||||
| 101 | |||||||||||||||||
|---|---|---|---|---|---|---|---|---|---|---|---|---|---|---|---|---|---|
| 102 | 7/25/2017 | Office of Planning and Research | |||||||||||||||
| 103 | |||||||||||||||||
| 104 | |||||||||||||||||
| 105 | |||||||||||||||||
| 106 | |||||||||||||||||
| 107 | |||||||||||||||||
| 108 | |||||||||||||||||
| 109 | |||||||||||||||||
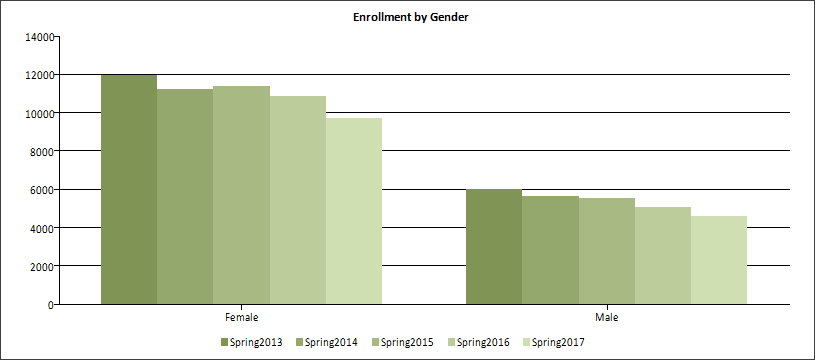
| 110 | |||||||||||||||||
| 111 | |||||||||||||||||
| 112 | |||||||||||||||||
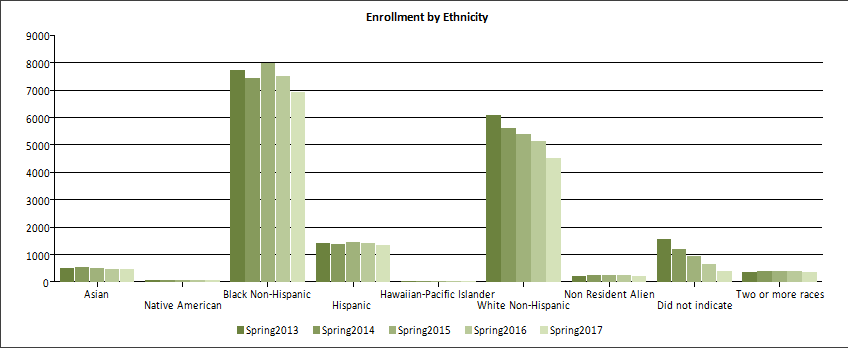
| 113 | |||||||||||||||||
| 114 | SUMMARY | ||||||||||||||||
| 115 | |||||||||||||||||
| 116 | |||||||||||||||||
| 117 | P | Enrollment decreased 10.3% from Spring 2016 (15,975) to Spring 2017 (14,331). | |||||||||||||||
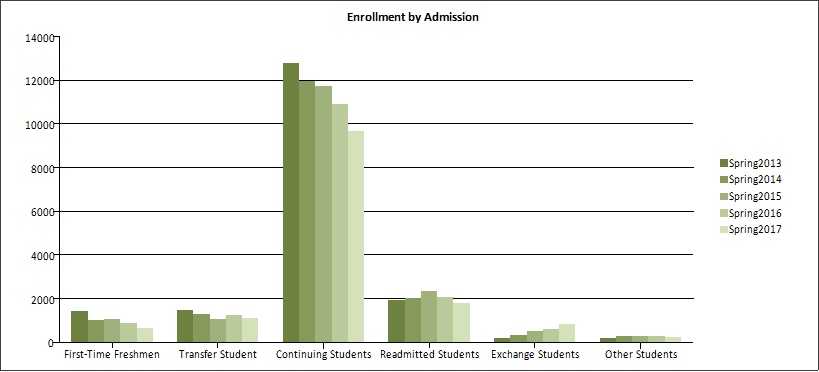
| 118 | |||||||||||||||||
| 119 | P | Male students decreased by 10.0% from Spring 2016; female students decreased by 10.4%. | |||||||||||||||
| 120 | The five-year trend away from male and towards female students has flattened this year. | ||||||||||||||||
| 121 | |||||||||||||||||
| 122 | P | Black Non-Hispanic enrollment decreased by 7.5% from Spring 2016. | |||||||||||||||
| 123 | Black Non-Hispanic students now make up 48.5% of the student body, a five-year high. | ||||||||||||||||
| 124 | |||||||||||||||||
| 125 | P | White Non-Hispanic enrollment decreased by 12.4%. | |||||||||||||||
| 126 | |||||||||||||||||
| 127 | P | First-time freshmen decreased 25.6% from last spring and now make up just 4.6% of the college. | |||||||||||||||
| 128 | Exchange students increased by 40.3%. DCC now has more exchange students than first-time freshmen. | ||||||||||||||||
| 129 | |||||||||||||||||
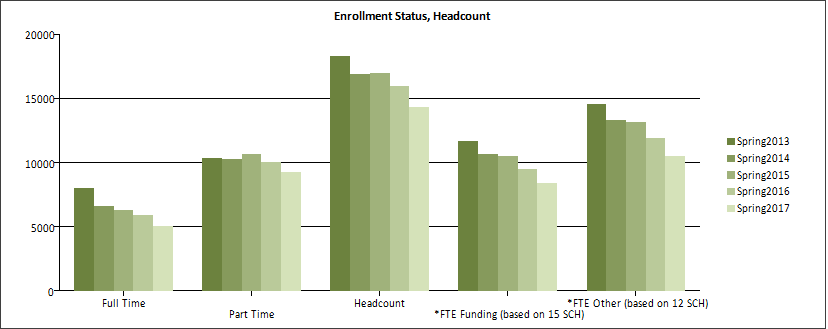
| 130 | P | The percentage of full-time students continued to decline, reaching a five-year low of 35.3%, | |||||||||||||||
| 131 | |||||||||||||||||
| 132 | P | The percentage of students taking an online class reached a new high of 36.1%. | |||||||||||||||
| 133 | Of students taking at least one course online, the average number of online courses was 1.88. | ||||||||||||||||
| 134 | |||||||||||||||||
| 135 | P | Nursing, General Studies and Business & Management had the largest enrollment in Spring 2017. | |||||||||||||||
| 136 | |||||||||||||||||
| 137 | |||||||||||||||||
| 138 | |||||||||||||||||
| 139 | |||||||||||||||||
| 140 | |||||||||||||||||
| 141 | |||||||||||||||||
| 142 | |||||||||||||||||
| 143 | |||||||||||||||||
| 144 | Data sources: End of Semester data for Spring 2014, Spring 2015, Spring 2016, Spring 2017 | ||||||||||||||||
| 145 | 14th Class Day data for Spring 2013 | ||||||||||||||||
| 146 | |||||||||||||||||
| 147 | |||||||||||||||||
| 148 | |||||||||||||||||
| 149 | |||||||||||||||||
| 150 | |||||||||||||||||
| 151 | |||||||||||||||||
|---|---|---|---|---|---|---|---|---|---|---|---|---|---|---|---|---|---|
| 152 | |||||||||||||||||
| 153 | |||||||||||||||||
| 154 | |||||||||||||||||
| 155 | 7/25/2017 | Office of Planning and Research | |||||||||||||||
| A | B | C | D | E | F | G | H | I | J | K | L | M | N | O | P | Q | R | S | |
|---|---|---|---|---|---|---|---|---|---|---|---|---|---|---|---|---|---|---|---|
| 1 | |||||||||||||||||||
| 2 | Spring Enrollment History 2013-2017 by Gender | ||||||||||||||||||
| 3 | |||||||||||||||||||
| 4 | Spring2012 | Spring2013 | Spring2014 | Spring2015 | Spring2016 | <- change year B to F | |||||||||||||
| 5 | Number | % | Number | % | |||||||||||||||
| 6 | College Wide | Change | Change | Change | Change | ||||||||||||||
| 7 | Gender | Spring | Spring | Spring | Spring | Spring | 2013 | 2013 | 2016 | 2016 | |||||||||
| 8 | 2013 | 2014 | 2015 | 2016 | 2017 | to 2017 | to 2017 | to 2017 | to 2017 | ||||||||||
| 9 | Female | 11,954 | 11,254 | 11,416 | 10,867 | 9,736 | -2,218 | -18.6% | -1,131 | -10.4% | |||||||||
| 10 | Male | 6,062 | 5,671 | 5,600 | 5,108 | 4,595 | -1,467 | -24.2% | -513 | -10.0% | |||||||||
| 11 | Total | 18,016 | 16,925 | 17,016 | 15,975 | 14,331 | -3,685 | -20.5% | -1,644 | -10.3% | |||||||||
| 12 | Percentages | ||||||||||||||||||
| 13 | Female | 66.4% | 66.5% | 67.1% | 68.0% | 67.9% | |||||||||||||
| 14 | Male | 33.6% | 33.5% | 32.9% | 32.0% | 32.1% | |||||||||||||
| 15 | |||||||||||||||||||
| 16 |
|
||||||||||||||||||
| 17 | |||||||||||||||||||
| 18 | |||||||||||||||||||
| 19 | |||||||||||||||||||
| 20 | |||||||||||||||||||
| 21 | |||||||||||||||||||
| 22 | |||||||||||||||||||
| 23 | |||||||||||||||||||
| 24 | |||||||||||||||||||
| 25 | |||||||||||||||||||
| 26 | |||||||||||||||||||
| 27 | |||||||||||||||||||
| 28 | |||||||||||||||||||
| 29 | |||||||||||||||||||
| 30 | |||||||||||||||||||
| 31 | |||||||||||||||||||
| 32 | |||||||||||||||||||
| 33 | |||||||||||||||||||
| 34 | |||||||||||||||||||
| 35 | |||||||||||||||||||
| 36 | |||||||||||||||||||
| 37 | |||||||||||||||||||
| 38 | |||||||||||||||||||
| 39 | |||||||||||||||||||
| 40 | |||||||||||||||||||
| 41 | Number | % | Number | % | |||||||||||||||
| 42 | Change | Change | Change | Change | |||||||||||||||
| 43 | City Park Campus | Spring | Spring | Spring | Spring | Spring | 2013 | 2013 | 2016 | 2016 | |||||||||
| 44 | Gender | 2013 | 2014 | 2015 | 2016 | 2017 | to 2017 | to 2017 | to 2017 | to 2017 | |||||||||
| 45 | Female | 7,057 | 6,921 | 7,201 | 6,653 | 6,673 | -384 | -5.4% | 20 | 0.3% | |||||||||
| 46 | Male | 3,973 | 3,781 | 3,789 | 3,247 | 3,265 | -708 | -17.8% | 18 | 0.6% | |||||||||
| 47 | Total | 11,030 | 10,702 | 10,990 | 9,900 | 9,938 | -1,092 | -9.9% | 38 | 0.4% | |||||||||
| 48 | |||||||||||||||||||
| 49 | |||||||||||||||||||
| 50 | West Bank Campus | ||||||||||||||||||
| 51 | Female | 2,127 | 1,835 | 1,910 | 1,796 | 1,779 | -348 | -16.4% | -17 | -0.9% | |||||||||
|---|---|---|---|---|---|---|---|---|---|---|---|---|---|---|---|---|---|---|---|
| 52 | Male | 827 | 738 | 700 | 609 | 596 | -231 | -27.9% | -13 | -2.1% | |||||||||
| 53 | Total | 2,954 | 2,573 | 2,610 | 2,405 | 2,375 | -579 | -19.6% | -30 | -1.2% | |||||||||
| 54 | |||||||||||||||||||
| 55 | |||||||||||||||||||
| 56 | Charity School of Nursing | ||||||||||||||||||
| 57 | Female | 564 | 607 | 624 | 615 | 614 | 50 | 8.9% | -1 | -0.2% | |||||||||
| 58 | Male | 88 | 108 | 88 | 86 | 83 | -5 | -5.7% | -3 | -3.5% | |||||||||
| 59 | Total | 652 | 715 | 712 | 701 | 697 | 45 | 6.9% | -4 | -0.6% | |||||||||
| 60 | |||||||||||||||||||
| 61 | |||||||||||||||||||
| 62 | *Northshore Site - Covington | ||||||||||||||||||
| 63 | Female | 1,107 | 711 | ||||||||||||||||
| 64 | Male | 374 | 237 | ||||||||||||||||
| 65 | Total | 1,481 | 948 | ||||||||||||||||
| 66 | |||||||||||||||||||
| 67 | *Northshore Site - Slidell | ||||||||||||||||||
| 68 | Female | 1,012 | 875 | 1,246 | 1,085 | ||||||||||||||
| 69 | Male | 448 | 390 | 506 | 415 | ||||||||||||||
| 70 | Total | 1,460 | 1,265 | 1,752 | 1,500 | ||||||||||||||
| 71 | |||||||||||||||||||
| 72 | *Northshore Site - Total | ||||||||||||||||||
| 73 | Female | 1,947 | 1,586 | 1,246 | 1,085 | ||||||||||||||
| 74 | Male | 794 | 627 | 506 | 415 | ||||||||||||||
| 75 | Total | 2,741 | 2,213 | 1,752 | 1,500 | ||||||||||||||
| 76 | *Site closed. | ||||||||||||||||||
| 77 | |||||||||||||||||||
| 78 | |||||||||||||||||||
| 79 | 7/25/2017 | Office of Planning and Research | |||||||||||||||||
| 80 | |||||||||||||||||||
| 81 | Spring Enrollment History 2013-2017 by Gender (cont.) | ||||||||||||||||||
| 82 | |||||||||||||||||||
| 83 | Number | % | Number | % | |||||||||||||||
| 84 | Change | Change | Change | Change | |||||||||||||||
| 85 | Technical Site - Jefferson | Spring | Spring | Spring | Spring | Spring | 2013 | 2013 | 2016 | 2016 | |||||||||
| 86 | 2013 | 2014 | 2015 | 2016 | 2017 | to 2017 | to 2017 | to 2017 | to 2017 | ||||||||||
| 87 | Female | 141 | 153 | 231 | 417 | 372 | 231 | 163.8% | -45 | -10.8% | |||||||||
| 88 | Male | 305 | 299 | 422 | 452 | 414 | 109 | 35.7% | -38 | -8.4% | |||||||||
| 89 | Total | 446 | 452 | 653 | 869 | 786 | 340 | 76.2% | -83 | -9.6% | |||||||||
| 90 | |||||||||||||||||||
| 91 | *Technical Site - West Jefferson | ||||||||||||||||||
| 92 | Female | 118 | 152 | ||||||||||||||||
| 93 | Male | 75 | 118 | ||||||||||||||||
| 94 | Total | 193 | 270 | ||||||||||||||||
| 95 | |||||||||||||||||||
| 96 | Technical Site - Total | ||||||||||||||||||
| 97 | Female | 259 | 305 | 231 | 417 | 372 | 113 | 43.6% | -45 | -10.8% | |||||||||
| 98 | Male | 380 | 417 | 422 | 452 | 414 | 34 | 8.9% | -38 | -8.4% | |||||||||
| 99 | Total | 639 | 722 | 653 | 869 | 786 | 147 | 23.0% | -83 | -9.6% | |||||||||
| 100 | *Site closed. | ||||||||||||||||||
| 101 | |||||||||||||||||||
|---|---|---|---|---|---|---|---|---|---|---|---|---|---|---|---|---|---|---|---|
| 102 | |||||||||||||||||||
| 103 | **Sidney Collier Site | ||||||||||||||||||
| 104 | Female | 204 | 301 | 298 | -3 | -1.0% | |||||||||||||
| 105 | Male | 95 | 299 | 237 | -62 | -20.7% | |||||||||||||
| 106 | Total | 299 | 600 | 535 | -65 | -10.8% | |||||||||||||
| 107 | **Sidney Collier Technical College was a part of Delgado Community College as of Spring 2014. | ||||||||||||||||||
| 108 | |||||||||||||||||||
| 109 | Spring Enrollment History 2013-2017 by Ethnicity | ||||||||||||||||||
| 110 | |||||||||||||||||||
| 111 | College Wide | Spring | Spring | Spring | Spring | Spring | 2013 | 2013 | 2016 | 2016 | |||||||||
| 112 | Ethnicity | 2013 | 2014 | 2015 | 2016 | 2017 | to 2017 | to 2017 | to 2017 | to 2017 | |||||||||
| 113 | Asian | 518 | 533 | 497 | 462 | 464 | -54 | -10.4% | 2 | 0.4% | |||||||||
| 114 | Native American | 53 | 70 | 75 | 80 | 61 | 8 | 15.1% | -19 | -23.8% | |||||||||
| 115 | Black Non-Hispanic | 7,736 | 7,437 | 7,982 | 7,513 | 6,948 | -788 | -10.2% | -565 | -7.5% | |||||||||
| 116 | Hispanic | 1,442 | 1,398 | 1,456 | 1,428 | 1,334 | -108 | -7.5% | -94 | -6.6% | |||||||||
| 117 | Hawaiian-Pacific Islander | 18 | 21 | 18 | 25 | 16 | -2 | -11.1% | -9 | -36.0% | |||||||||
| 118 | White Non-Hispanic | 6,089 | 5,630 | 5,403 | 5,149 | 4,513 | -1,576 | -25.9% | -636 | -12.4% | |||||||||
| 119 | Non Resident Alien | 210 | 238 | 253 | 263 | 225 | 15 | 7.1% | -38 | -14.4% | |||||||||
| 120 | Did not indicate | 1,574 | 1,205 | 930 | 658 | 388 | -1,186 | -75.3% | -270 | -41.0% | |||||||||
| 121 | Two or more races | 376 | 393 | 402 | 397 | 382 | 6 | 1.6% | -15 | -3.8% | |||||||||
| 122 | Total | 18,016 | 16,925 | 17,016 | 15,975 | 14,331 | -3,685 | -20.5% | -1,644 | -10.3% | |||||||||
| 123 | |||||||||||||||||||
| 124 | Percentages | ||||||||||||||||||
| 125 | Asian | 2.9% | 3.1% | 2.9% | 2.9% | 3.2% | |||||||||||||
| 126 | Native American | 0.3% | 0.4% | 0.4% | 0.5% | 0.4% | |||||||||||||
| 127 | Black Non-Hispanic | 42.9% | 43.9% | 46.9% | 47.0% | 48.5% | |||||||||||||
| 128 | Hispanic | 8.0% | 8.3% | 8.6% | 8.9% | 9.3% | |||||||||||||
| 129 | Hawaiian-Pacific Islander | 0.1% | 0.1% | 0.1% | 0.2% | 0.1% | |||||||||||||
| 130 | White Non-Hispanic | 33.8% | 33.3% | 31.8% | 32.2% | 31.5% | |||||||||||||
| 131 | Non Resident Alien | 1.2% | 1.4% | 1.5% | 1.6% | 1.6% | |||||||||||||
| 132 | Did not indicate | 8.7% | 7.1% | 5.5% | 4.1% | 2.7% | |||||||||||||
| 133 | Two or more races | 2.1% | 2.3% | 2.4% | 2.5% | 2.7% | |||||||||||||
| 134 | |||||||||||||||||||
| 135 |
|
||||||||||||||||||
| 136 | |||||||||||||||||||
| 137 | |||||||||||||||||||
| 138 | |||||||||||||||||||
| 139 | |||||||||||||||||||
| 140 | |||||||||||||||||||
| 141 | |||||||||||||||||||
| 142 | |||||||||||||||||||
| 143 | |||||||||||||||||||
| 144 | |||||||||||||||||||
| 145 | |||||||||||||||||||
| 146 | |||||||||||||||||||
| 147 | |||||||||||||||||||
| 148 | |||||||||||||||||||
| 149 | |||||||||||||||||||
| 150 | |||||||||||||||||||
| 151 | |||||||||||||||||||
| 152 | |||||||||||||||||||
| 153 | |||||||||||||||||||
| 154 | |||||||||||||||||||
| 155 | |||||||||||||||||||
| 156 | |||||||||||||||||||
| 157 | |||||||||||||||||||
| 158 | 7/25/2017 | Office of Planning and Research | |||||||||||||||||
| 159 | |||||||||||||||||||
| 160 | Spring Enrollment History 2013-2017 Ethnicity by Campus/Site | ||||||||||||||||||
| 161 | |||||||||||||||||||
| 162 | Number | % | Number | % | |||||||||||||||
| 163 | Change | Change | Change | Change | |||||||||||||||
| 164 | City Park Campus | Spring | Spring | Spring | Spring | Spring | 2013 | 2013 | 2016 | 2016 | |||||||||
| 165 | Ethnicity | 2013 | 2014 | 2015 | 2016 | 2017 | to 2017 | to 2017 | to 2017 | to 2017 | |||||||||
| 166 | Asian | 348 | 366 | 359 | 319 | 334 | -14 | -4.0% | 15 | 4.7% | |||||||||
| 167 | Native American | 29 | 38 | 42 | 48 | 40 | 11 | 37.9% | -8 | -16.7% | |||||||||
| 168 | Black Non-Hispanic | 4865 | 4761 | 5092 | 4660 | 4558 | -307 | -6.3% | -102 | -2.2% | |||||||||
| 169 | Hispanic | 1059 | 1008 | 1048 | 966 | 969 | -90 | -8.5% | 3 | 0.3% | |||||||||
| 170 | Hawaiian-Pacific Islander | 10 | 14 | 13 | 16 | 11 | 1 | 10.0% | -5 | -31.3% | |||||||||
| 171 | White Non-Hispanic | 3502 | 3312 | 3359 | 2992 | 3284 | -218 | -6.2% | 292 | 9.8% | |||||||||
| 172 | Non Resident Alien | 198 | 219 | 236 | 242 | 209 | 11 | 5.6% | -33 | -13.6% | |||||||||
| 173 | Did not indicate | 782 | 737 | 578 | 409 | 275 | -507 | -64.8% | -134 | -32.8% | |||||||||
| 174 | Two or more races | 237 | 247 | 263 | 248 | 258 | 21 | 8.9% | 10 | 4.0% | |||||||||
| 175 | Total | 11,030 | 10,702 | 10,990 | 9,900 | 9,938 | -1,092 | -9.9% | 38 | 0.4% | |||||||||
| 176 | |||||||||||||||||||
| 177 | West Bank Campus | ||||||||||||||||||
| 178 | Asian | 112 | 108 | 82 | 78 | 75 | -37 | -33.0% | -3 | -3.8% | |||||||||
| 179 | Native American | 14 | 13 | 15 | 12 | 11 | -3 | -21.4% | -1 | -8.3% | |||||||||
| 180 | Black Non-Hispanic | 1695 | 1497 | 1627 | 1527 | 1450 | -245 | -14.5% | -77 | -5.0% | |||||||||
| 181 | Hispanic | 171 | 172 | 168 | 156 | 180 | 9 | 5.3% | 24 | 15.4% | |||||||||
| 182 | Hawaiian-Pacific Islander | 4 | 2 | 2 | 3 | 3 | -1 | -25.0% | 0 | 0.0% | |||||||||
| 183 | White Non-Hispanic | 609 | 552 | 500 | 479 | 508 | -101 | -16.6% | 29 | 6.1% | |||||||||
| 184 | Non Resident Alien | 4 | 6 | 7 | 5 | 5 | 1 | 25.0% | 0 | 0.0% | |||||||||
| 185 | Did not indicate | 284 | 170 | 151 | 92 | 59 | -225 | -79.2% | -33 | -35.9% | |||||||||
| 186 | Two or more races | 61 | 53 | 58 | 53 | 84 | 23 | 37.7% | 31 | 58.5% | |||||||||
| 187 | Total | 2,954 | 2,573 | 2,610 | 2,405 | 2,375 | -579 | -19.6% | -30 | -1.2% | |||||||||
| 188 | |||||||||||||||||||
| 189 | Charity School of Nursing | ||||||||||||||||||
| 190 | Asian | 25 | 23 | 20 | 20 | 25 | 0 | 0.0% | 5 | 25.0% | |||||||||
| 191 | Native American | 3 | 6 | 7 | 6 | 4 | 1 | 33.3% | -2 | -33.3% | |||||||||
| 192 | Black Non-Hispanic | 165 | 198 | 200 | 192 | 190 | 25 | 15.2% | -2 | -1.0% | |||||||||
| 193 | Hispanic | 48 | 57 | 69 | 71 | 75 | 27 | 56.3% | 4 | 5.6% | |||||||||
| 194 | Hawaiian-Pacific Islander | 1 | 1 | 0 | 1 | 2 | 1 | 100.0% | 1 | 100.0% | |||||||||
| 195 | White Non-Hispanic | 345 | 368 | 363 | 358 | 354 | 9 | 2.6% | -4 | -1.1% | |||||||||
| 196 | Non Resident Alien | 5 | 4 | 4 | 5 | 5 | 0 | 0.0% | 0 | 0.0% | |||||||||
| 197 | Did not indicate | 52 | 47 | 38 | 32 | 23 | -29 | -55.8% | -9 | -28.1% | |||||||||
| 198 | Two or more races | 8 | 11 | 11 | 16 | 19 | 11 | 137.5% | 3 | 18.8% | |||||||||
| 199 | Total | 652 | 715 | 712 | 701 | 697 | 45 | 6.9% | -4 | -0.6% | |||||||||
| 200 | |||||||||||||||||||
| 201 | *Northshore Site - Covington | ||||||||||||||||||
|---|---|---|---|---|---|---|---|---|---|---|---|---|---|---|---|---|---|---|---|
| 202 | Asian | 5 | 8 | ||||||||||||||||
| 203 | Native American | 7 | 4 | ||||||||||||||||
| 204 | Black Non-Hispanic | 426 | 251 | ||||||||||||||||
| 205 | Hispanic | 52 | 49 | ||||||||||||||||
| 206 | Hawaiian-Pacific Islander | 1 | 2 | ||||||||||||||||
| 207 | White Non-Hispanic | 856 | 538 | ||||||||||||||||
| 208 | Non Resident Alien | 2 | 2 | ||||||||||||||||
| 209 | Did not indicate | 101 | 74 | ||||||||||||||||
| 210 | Two or more races | 31 | 20 | ||||||||||||||||
| 211 | Total | 1,481 | 948 | ||||||||||||||||
| 212 | |||||||||||||||||||
| 213 | *Northshore Site - Slidell | ||||||||||||||||||
| 214 | Asian | 12 | 14 | 18 | 14 | ||||||||||||||
| 215 | Native American | 5 | 5 | 8 | 9 | ||||||||||||||
| 216 | Black Non-Hispanic | 367 | 317 | 487 | 392 | ||||||||||||||
| 217 | Hispanic | 60 | 52 | 96 | 89 | ||||||||||||||
| 218 | Hawaiian-Pacific Islander | 1 | 1 | 2 | 1 | ||||||||||||||
| 219 | White Non-Hispanic | 765 | 696 | 974 | 878 | ||||||||||||||
| 220 | Non Resident Alien | 0 | 5 | 2 | 2 | ||||||||||||||
| 221 | Did not indicate | 210 | 130 | 113 | 60 | ||||||||||||||
| 222 | Two or more races | 40 | 45 | 52 | 55 | ||||||||||||||
| 223 | Total | 1,460 | 1,265 | 1,752 | 1,500 | ||||||||||||||
| 224 | |||||||||||||||||||
| 225 | *Northshore Site - Total | ||||||||||||||||||
| 226 | Asian | 19 | 22 | 18 | 14 | ||||||||||||||
| 227 | Native American | 6 | 9 | 8 | 9 | ||||||||||||||
| 228 | Black Non-Hispanic | 663 | 568 | 487 | 392 | ||||||||||||||
| 229 | Hispanic | 112 | 101 | 96 | 89 | ||||||||||||||
| 230 | Hawaiian-Pacific Islander | 2 | 3 | 2 | 1 | ||||||||||||||
| 231 | White Non-Hispanic | 1445 | 1,234 | 974 | 878 | ||||||||||||||
| 232 | Non Resident Alien | 3 | 7 | 2 | 2 | ||||||||||||||
| 233 | Did not indicate | 426 | 204 | 113 | 60 | ||||||||||||||
| 234 | Two or more races | 65 | 65 | 52 | 55 | ||||||||||||||
| 235 | Total | 2,741 | 2,213 | 1,752 | 1,500 | ||||||||||||||
| 236 | |||||||||||||||||||
| 237 | |||||||||||||||||||
| 238 | 7/25/2017 | Office of Planning and Research | |||||||||||||||||
| 239 | |||||||||||||||||||
| 240 | Spring Enrollment History 2013-2017 Ethnicity by Campus/Site (cont.) | ||||||||||||||||||
| 241 | |||||||||||||||||||
| 242 | Number | % | Number | % | |||||||||||||||
| 243 | Change | Change | Change | Change | |||||||||||||||
| 244 | Technical Site - Jefferson | Spring | Spring | Spring | Spring | Spring | 2013 | 2013 | 2016 | 2016 | |||||||||
| 245 | 2013 | 2014 | 2015 | 2016 | 2017 | to 2017 | to 2017 | to 2017 | to 2017 | ||||||||||
| 246 | Asian | 10 | 13 | 17 | 15 | 19 | 9 | 90.0% | 4 | 26.7% | |||||||||
| 247 | Native American | 0 | 0 | 1 | 2 | 6 | 6 | n/a | 4 | 200.0% | |||||||||
| 248 | Black Non-Hispanic | 204 | 227 | 320 | 368 | 384 | 180 | 88.2% | 16 | 4.3% | |||||||||
| 249 | Hispanic | 50 | 44 | 66 | 105 | 76 | 26 | 52.0% | -29 | -27.6% | |||||||||
| 250 | Hawaiian-Pacific Islander | 1 | 1 | 1 | 3 | 0 | -1 | -100.0% | -3 | -100.0% | |||||||||
| 251 | White Non-Hispanic | 156 | 133 | 192 | 309 | 257 | 101 | 64.7% | -52 | -16.8% | |||||||||
|---|---|---|---|---|---|---|---|---|---|---|---|---|---|---|---|---|---|---|---|
| 252 | Non Resident Alien | 0 | 1 | 4 | 7 | 5 | 5 | n/a | -2 | -28.6% | |||||||||
| 253 | Did not indicate | 21 | 25 | 38 | 40 | 20 | -1 | -4.8% | -20 | -50.0% | |||||||||
| 254 | Two or more races | 4 | 8 | 14 | 20 | 19 | 15 | 375.0% | -1 | -5.0% | |||||||||
| 255 | Total | 446 | 452 | 653 | 869 | 786 | 340 | 76.2% | -83 | -9.6% | |||||||||
| 256 | |||||||||||||||||||
| 257 | *Technical Site - West Jefferson | ||||||||||||||||||
| 258 | Asian | 4 | 1 | ||||||||||||||||
| 259 | Native American | 1 | 4 | ||||||||||||||||
| 260 | Black Non-Hispanic | 144 | 186 | ||||||||||||||||
| 261 | Hispanic | 2 | 16 | ||||||||||||||||
| 262 | Hawaiian-Pacific Islander | 0 | 0 | ||||||||||||||||
| 263 | White Non-Hispanic | 32 | 31 | ||||||||||||||||
| 264 | Non Resident Alien | 0 | 1 | ||||||||||||||||
| 265 | Did not indicate | 9 | 22 | ||||||||||||||||
| 266 | Two or more races | 1 | 9 | ||||||||||||||||
| 267 | Total | 193 | 270 | ||||||||||||||||
| 268 | |||||||||||||||||||
| 269 | Technical Site - Total | ||||||||||||||||||
| 270 | Asian | 14 | 14 | 17 | 15 | 19 | 5 | 35.7% | 4 | 26.7% | |||||||||
| 271 | Native American | 1 | 4 | 1 | 2 | 6 | 5 | 500.0% | 4 | 200.0% | |||||||||
| 272 | Black Non-Hispanic | 348 | 413 | 320 | 368 | 384 | 36 | 10.3% | 16 | 4.3% | |||||||||
| 273 | Hispanic | 52 | 60 | 66 | 105 | 76 | 24 | 46.2% | -29 | -27.6% | |||||||||
| 274 | Hawaiian-Pacific Islander | 1 | 1 | 1 | 3 | 0 | -1 | n/a | -3 | -100.0% | |||||||||
| 275 | White Non-Hispanic | 188 | 164 | 192 | 309 | 257 | 69 | 36.7% | -52 | -16.8% | |||||||||
| 276 | Non Resident Alien | 0 | 2 | 4 | 7 | 5 | 5 | 0.0% | -2 | -28.6% | |||||||||
| 277 | Did not indicate | 30 | 47 | 38 | 40 | 20 | -10 | -33.3% | -20 | -50.0% | |||||||||
| 278 | Two or more races | 5 | 17 | 14 | 20 | 19 | 14 | 280.0% | -1 | -5.0% | |||||||||
| 279 | Total | 639 | 722 | 653 | 869 | 786 | 147 | 23.0% | -83 | -9.6% | |||||||||
| 280 | |||||||||||||||||||
| 281 | |||||||||||||||||||
| 282 | Sidney Collier Site | ||||||||||||||||||
| 283 | Asian | 1 | 16 | 11 | -5 | -31.3% | |||||||||||||
| 284 | Native American | 2 | 3 | 0 | -3 | -100.0% | |||||||||||||
| 285 | Black Non-Hispanic | 256 | 374 | 366 | -8 | -2.1% | |||||||||||||
| 286 | Hispanic | 9 | 41 | 34 | -7 | -17.1% | |||||||||||||
| 287 | Hawaiian-Pacific Islander | 0 | 1 | 0 | -1 | -100.0% | |||||||||||||
| 288 | White Non-Hispanic | 15 | 133 | 110 | -23 | -17.3% | |||||||||||||
| 289 | Non Resident Alien | 0 | 2 | 1 | -1 | -50.0% | |||||||||||||
| 290 | Did not indicate | 12 | 25 | 11 | -14 | -56.0% | |||||||||||||
| 291 | Two or more races | 4 | 5 | 2 | -3 | -60.0% | |||||||||||||
| 292 | Total | 299 | 600 | 535 | -65 | -10.8% | |||||||||||||
| 293 | |||||||||||||||||||
| 294 | |||||||||||||||||||
| 295 | |||||||||||||||||||
| 296 | Spring Enrollment History 2013-2017 by Age | ||||||||||||||||||
| 297 | |||||||||||||||||||
| 298 | Number | % | Number | % | |||||||||||||||
| 299 | College Wide | Change | Change | Change | Change | ||||||||||||||
| 300 | Age | Spring | Spring | Spring | Spring | Spring | 2013 | 2013 | 2016 | 2016 | |||||||||
| 301 | 2013 | 2014 | 2015 | 2016 | 2017 | to 2017 | to 2017 | to 2017 | to 2017 | ||||||||||
|---|---|---|---|---|---|---|---|---|---|---|---|---|---|---|---|---|---|---|---|
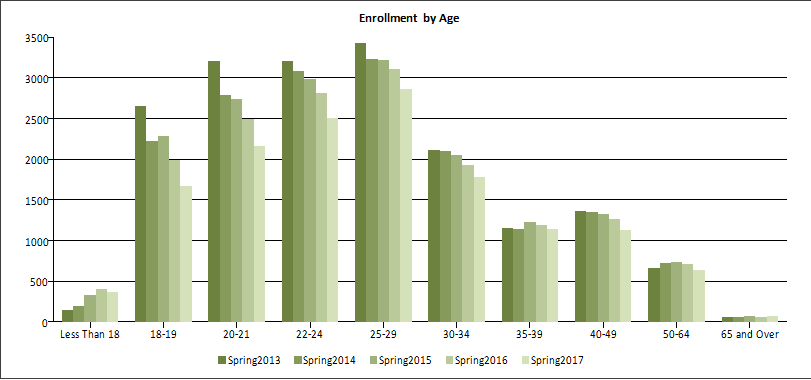
| 302 | Less Than 18 | 149 | 195 | 334 | 401 | 364 | 215 | 144.3% | -37 | -9.2% | |||||||||
| 303 | 18-19 | 2,654 | 2,229 | 2,293 | 1,989 | 1,666 | -988 | -37.2% | -323 | -16.2% | |||||||||
| 304 | 20-21 | 3,213 | 2,786 | 2,745 | 2,494 | 2,161 | -1,052 | -32.7% | -333 | -13.4% | |||||||||
| 305 | 22-24 | 3,210 | 3,079 | 2,981 | 2,813 | 2,508 | -702 | -21.9% | -305 | -10.8% | |||||||||
| 306 | 25-29 | 3,431 | 3,230 | 3,222 | 3,110 | 2,869 | -562 | -16.4% | -241 | -7.7% | |||||||||
| 307 | 30-34 | 2,113 | 2,103 | 2,058 | 1,929 | 1,783 | -330 | -15.6% | -146 | -7.6% | |||||||||
| 308 | 35-39 | 1,154 | 1,148 | 1,229 | 1,199 | 1,143 | -11 | -1.0% | -56 | -4.7% | |||||||||
| 309 | 40-49 | 1,364 | 1,359 | 1,335 | 1,272 | 1,130 | -234 | -17.2% | -142 | -11.2% | |||||||||
| 310 | 50-64 | 667 | 729 | 744 | 708 | 637 | -30 | -4.5% | -71 | -10.0% | |||||||||
| 311 | 65 and Over | 61 | 67 | 75 | 60 | 70 | 9 | 14.8% | 10 | 16.7% | |||||||||
| 312 | Total | 18,016 | 16,925 | 17,016 | 15,975 | 14,331 | -3,685 | -20.5% | -1,644 | -10.3% | |||||||||
| 313 | Average Age | 27.1 | 27.5 | 27.9 | 27.9 | 28.0 | |||||||||||||
| 314 | |||||||||||||||||||
| 315 | |||||||||||||||||||
| 316 | |||||||||||||||||||
| 317 | 7/25/2017 | Office of Planning and Research | |||||||||||||||||
| 318 | |||||||||||||||||||
| 319 | Spring Enrollment History 2013-2017 by Age | ||||||||||||||||||
| 320 | |||||||||||||||||||
| 321 | Age | Spring | Spring | Spring | Spring | Spring | |||||||||||||
| 322 | 2013 | 2014 | 2015 | 2016 | 2017 | ||||||||||||||
| 323 | Percentages | ||||||||||||||||||
| 324 | Less Than 18 | 0.8% | 1.2% | 2.0% | 2.5% | 2.5% | |||||||||||||
| 325 | 18-19 | 14.7% | 13.2% | 13.5% | 12.5% | 11.6% | |||||||||||||
| 326 | 20-21 | 17.8% | 16.5% | 16.1% | 15.6% | 15.1% | |||||||||||||
| 327 | 22-24 | 17.8% | 18.2% | 17.5% | 17.6% | 17.5% | |||||||||||||
| 328 | 25-29 | 19.0% | 19.1% | 18.9% | 19.5% | 20.0% | |||||||||||||
| 329 | 30-34 | 11.7% | 12.4% | 12.1% | 12.1% | 12.4% | |||||||||||||
| 330 | 35-39 | 6.4% | 6.8% | 7.2% | 7.5% | 8.0% | |||||||||||||
| 331 | 40-49 | 7.6% | 8.0% | 7.8% | 8.0% | 7.9% | |||||||||||||
| 332 | 50-64 | 3.7% | 4.3% | 4.4% | 4.4% | 4.4% | |||||||||||||
| 333 | 65 and Over | 0.3% | 0.4% | 0.4% | 0.4% | 0.5% | |||||||||||||
| 334 | |||||||||||||||||||
| 335 |
|
||||||||||||||||||
| 336 | |||||||||||||||||||
| 337 | |||||||||||||||||||
| 338 | |||||||||||||||||||
| 339 | |||||||||||||||||||
| 340 | |||||||||||||||||||
| 341 | |||||||||||||||||||
| 342 | |||||||||||||||||||
| 343 | |||||||||||||||||||
| 344 | |||||||||||||||||||
| 345 | |||||||||||||||||||
| 346 | |||||||||||||||||||
| 347 | |||||||||||||||||||
| 348 | |||||||||||||||||||
| 349 | |||||||||||||||||||
| 350 | |||||||||||||||||||
| 351 | |||||||||||||||||||
| 352 | |||||||||||||||||||
| 353 | |||||||||||||||||||
| 354 | |||||||||||||||||||
| 355 | |||||||||||||||||||
| 356 | |||||||||||||||||||
| 357 | |||||||||||||||||||
| 358 | |||||||||||||||||||
| 359 | |||||||||||||||||||
| 360 | |||||||||||||||||||
| 361 | Spring Enrollment History 2013-2017 by Age by Campus/Site | ||||||||||||||||||
| 362 | |||||||||||||||||||
| 363 | |||||||||||||||||||
| 364 | Number | % | Number | % | |||||||||||||||
| 365 | Change | Change | Change | Change | |||||||||||||||
| 366 | City Park Campus | Spring | Spring | Spring | Spring | Spring | 2013 | 2013 | 2016 | 2016 | |||||||||
| 367 | Age | 2013 | 2014 | 2015 | 2016 | 2017 | to 2017 | to 2017 | to 2017 | to 2017 | |||||||||
| 368 | Less Than 18 | 92 | 104 | 214 | 238 | 211 | 119 | 129.3% | -27 | -11.3% | |||||||||
| 369 | 18-19 | 1,615 | 1,433 | 1,543 | 1,257 | 1,108 | -507 | -31.4% | -149 | -11.9% | |||||||||
| 370 | 20-21 | 1,957 | 1,803 | 1,833 | 1,590 | 1,591 | -366 | -18.7% | 1 | 0.1% | |||||||||
| 371 | 22-24 | 2,049 | 2,059 | 1,999 | 1,835 | 1,839 | -210 | -10.2% | 4 | 0.2% | |||||||||
| 372 | 25-29 | 2,123 | 2,007 | 2,125 | 1,959 | 1,992 | -131 | -6.2% | 33 | 1.7% | |||||||||
| 373 | 30-34 | 1,287 | 1,295 | 1,264 | 1,142 | 1,189 | -98 | -7.6% | 47 | 4.1% | |||||||||
| 374 | 35-39 | 661 | 692 | 712 | 684 | 762 | 101 | 15.3% | 78 | 11.4% | |||||||||
| 375 | 40-49 | 793 | 806 | 785 | 726 | 758 | -35 | -4.4% | 32 | 4.4% | |||||||||
| 376 | 50-64 | 422 | 466 | 474 | 433 | 437 | 15 | 3.6% | 4 | 0.9% | |||||||||
| 377 | 65 and Over | 31 | 37 | 41 | 36 | 51 | 20 | 64.5% | 15 | 41.7% | |||||||||
| 378 | Total | 11,030 | 10,702 | 10,990 | 9,900 | 9,938 | -1,092 | -9.9% | 38 | 0.4% | |||||||||
| 379 | |||||||||||||||||||
| 380 | |||||||||||||||||||
| 381 | West Bank Campus | ||||||||||||||||||
| 382 | Less Than 18 | 32 | 49 | 66 | 71 | 112 | 80 | 250.0% | 41 | 57.7% | |||||||||
| 383 | 18-19 | 434 | 358 | 369 | 329 | 384 | -50 | -11.5% | 55 | 16.7% | |||||||||
| 384 | 20-21 | 596 | 465 | 457 | 395 | 376 | -220 | -36.9% | -19 | -4.8% | |||||||||
| 385 | 22-24 | 529 | 455 | 431 | 407 | 360 | -169 | -31.9% | -47 | -11.5% | |||||||||
| 386 | 25-29 | 535 | 455 | 445 | 404 | 430 | -105 | -19.6% | 26 | 6.4% | |||||||||
| 387 | 30-34 | 291 | 289 | 285 | 265 | 254 | -37 | -12.7% | -11 | -4.2% | |||||||||
| 388 | 35-39 | 188 | 161 | 190 | 187 | 171 | -17 | -9.0% | -16 | -8.6% | |||||||||
| 389 | 40-49 | 231 | 211 | 225 | 217 | 173 | -58 | -25.1% | -44 | -20.3% | |||||||||
| 390 | 50-64 | 97 | 110 | 119 | 113 | 98 | 1 | 1.0% | -15 | -13.3% | |||||||||
| 391 | 65 and Over | 21 | 20 | 23 | 17 | 17 | -4 | -19.0% | 0 | 0.0% | |||||||||
| 392 | Total | 2,954 | 2,573 | 2,610 | 2,405 | 2,375 | -579 | -19.6% | -30 | -1.2% | |||||||||
| 393 | |||||||||||||||||||
| 394 | |||||||||||||||||||
| 395 | 7/25/2017 | Office of Planning and Research | |||||||||||||||||
| 396 | |||||||||||||||||||
| 397 | Spring Enrollment History 2013-2017 by Age by Campus/Site (cont.) | ||||||||||||||||||
| 398 | |||||||||||||||||||
| 399 | Number | % | Number | % | |||||||||||||||
| 400 | Change | Change | Change | Change | |||||||||||||||
| 401 | Charity School of Nursing | Spring | Spring | Spring | Spring | Spring | 2013 | 2013 | 2016 | 2016 | |||||||||
|---|---|---|---|---|---|---|---|---|---|---|---|---|---|---|---|---|---|---|---|
| 402 | 2013 | 2014 | 2015 | 2016 | 2017 | to 2017 | to 2017 | to 2017 | to 2017 | ||||||||||
| 403 | Less Than 18 | 0 | 0 | 1 | 0 | 0 | 0 | n/a | 0 | n/a | |||||||||
| 404 | 18-19 | 4 | 4 | 2 | 2 | 0 | -4 | 0.0% | -2 | -100.0% | |||||||||
| 405 | 20-21 | 33 | 35 | 33 | 60 | 30 | -3 | -9.1% | -30 | -50.0% | |||||||||
| 406 | 22-24 | 105 | 100 | 108 | 111 | 121 | 16 | 15.2% | 10 | 9.0% | |||||||||
| 407 | 25-29 | 195 | 218 | 193 | 205 | 202 | 7 | 3.6% | -3 | -1.5% | |||||||||
| 408 | 30-34 | 116 | 147 | 165 | 135 | 146 | 30 | 25.9% | 11 | 8.1% | |||||||||
| 409 | 35-39 | 93 | 106 | 104 | 88 | 91 | -2 | -2.2% | 3 | 3.4% | |||||||||
| 410 | 40-49 | 85 | 88 | 82 | 73 | 80 | -5 | -5.9% | 7 | 9.6% | |||||||||
| 411 | 50-64 | 21 | 17 | 24 | 27 | 27 | 6 | 28.6% | 0 | 0.0% | |||||||||
| 412 | 65 and Over | 0 | 0 | 0 | 0 | 0 | 0 | n/a | 0 | n/a | |||||||||
| 413 | Total | 652 | 715 | 712 | 701 | 697 | 45 | 6.9% | -4 | -0.6% | |||||||||
| 414 | |||||||||||||||||||
| 415 | |||||||||||||||||||
| 416 | Northshore Site - Covington | ||||||||||||||||||
| 417 | Less Than 18 | 8 | 2 | ||||||||||||||||
| 418 | 18-19 | 221 | 122 | ||||||||||||||||
| 419 | 20-21 | 291 | 155 | ||||||||||||||||
| 420 | 22-24 | 244 | 171 | ||||||||||||||||
| 421 | 25-29 | 262 | 184 | ||||||||||||||||
| 422 | 30-34 | 183 | 136 | ||||||||||||||||
| 423 | 35-39 | 101 | 54 | ||||||||||||||||
| 424 | 40-49 | 118 | 85 | ||||||||||||||||
| 425 | 50-64 | 48 | 35 | ||||||||||||||||
| 426 | 65 and Over | 5 | 4 | ||||||||||||||||
| 427 | Total | 1,481 | 948 | ||||||||||||||||
| 428 | |||||||||||||||||||
| 429 | Northshore Site - Slidell | ||||||||||||||||||
| 430 | Less Than 18 | 10 | 12 | 25 | 5 | ||||||||||||||
| 431 | 18-19 | 246 | 222 | 258 | 221 | ||||||||||||||
| 432 | 20-21 | 245 | 225 | 297 | 260 | ||||||||||||||
| 433 | 22-24 | 250 | 198 | 309 | 246 | ||||||||||||||
| 434 | 25-29 | 270 | 231 | 282 | 270 | ||||||||||||||
| 435 | 30-34 | 170 | 142 | 212 | 175 | ||||||||||||||
| 436 | 35-39 | 104 | 84 | 147 | 127 | ||||||||||||||
| 437 | 40-49 | 114 | 109 | 155 | 128 | ||||||||||||||
| 438 | 50-64 | 46 | 39 | 59 | 63 | ||||||||||||||
| 439 | 65 and Over | 5 | 3 | 8 | 5 | ||||||||||||||
| 440 | Total | 1,460 | 1,265 | 1,752 | 1,500 | ||||||||||||||
| 441 | |||||||||||||||||||
| 442 | Northshore Site - Total | ||||||||||||||||||
| 443 | Less Than 18 | 19 | 14 | 25 | 5 | ||||||||||||||
| 444 | 18-19 | 504 | 344 | 258 | 221 | ||||||||||||||
| 445 | 20-21 | 550 | 380 | 297 | 260 | ||||||||||||||
| 446 | 22-24 | 445 | 369 | 309 | 246 | ||||||||||||||
| 447 | 25-29 | 471 | 415 | 282 | 270 | ||||||||||||||
| 448 | 30-34 | 312 | 278 | 212 | 175 | ||||||||||||||
| 449 | 35-39 | 159 | 138 | 147 | 127 | ||||||||||||||
| 450 | 40-49 | 194 | 194 | 155 | 128 | ||||||||||||||
| 451 | 50-64 | 79 | 74 | 59 | 63 | ||||||||||||||
|---|---|---|---|---|---|---|---|---|---|---|---|---|---|---|---|---|---|---|---|
| 452 | 65 and Over | 8 | 7 | 8 | 5 | ||||||||||||||
| 453 | Total | 2,741 | 2,213 | 1,752 | 1,500 | ||||||||||||||
| 454 | |||||||||||||||||||
| 455 | |||||||||||||||||||
| 456 | Technical Site - Jefferson | ||||||||||||||||||
| 457 | Less Than 18 | 2 | 12 | 27 | 86 | 39 | 37 | 1850.0% | -47 | -54.7% | |||||||||
| 458 | 18-19 | 66 | 58 | 90 | 123 | 136 | 70 | 106.1% | 13 | 10.6% | |||||||||
| 459 | 20-21 | 52 | 57 | 87 | 99 | 95 | 43 | 82.7% | -4 | -4.0% | |||||||||
| 460 | 22-24 | 51 | 58 | 93 | 112 | 101 | 50 | 98.0% | -11 | -9.8% | |||||||||
| 461 | 25-29 | 71 | 80 | 112 | 156 | 140 | 69 | 97.2% | -16 | -10.3% | |||||||||
| 462 | 30-34 | 77 | 70 | 82 | 123 | 103 | 26 | 33.8% | -20 | -16.3% | |||||||||
| 463 | 35-39 | 38 | 28 | 56 | 58 | 56 | 18 | 47.4% | -2 | -3.4% | |||||||||
| 464 | 40-49 | 49 | 42 | 57 | 77 | 69 | 20 | 40.8% | -8 | -10.4% | |||||||||
| 465 | 50-64 | 40 | 45 | 47 | 33 | 46 | 6 | 15.0% | 13 | 39.4% | |||||||||
| 466 | 65 and Over | 0 | 2 | 2 | 2 | 1 | 1 | n/a | -1 | -50.0% | |||||||||
| 467 | Total | 446 | 452 | 653 | 869 | 786 | 340 | 76.2% | -83 | -9.6% | |||||||||
| 468 | |||||||||||||||||||
| 469 | |||||||||||||||||||
| 470 | |||||||||||||||||||
| 471 | 7/25/2017 | Office of Planning and Research | |||||||||||||||||
| 472 | |||||||||||||||||||
| 473 | Spring Enrollment History 2013-2017 by Age by Campus/Site (cont.) | ||||||||||||||||||
| 474 | |||||||||||||||||||
| 475 | Number | % | Number | % | |||||||||||||||
| 476 | Change | Change | Change | Change | |||||||||||||||
| 477 | Technical Site - West Jefferson | Spring | Spring | Spring | Spring | Spring | 2013 | 2013 | 2016 | 2016 | |||||||||
| 478 | 2013 | 2014 | 2015 | 2016 | 2017 | to 2017 | to 2017 | to 2017 | to 2017 | ||||||||||
| 479 | Less Than 18 | 4 | 16 | ||||||||||||||||
| 480 | 18-19 | 31 | 32 | ||||||||||||||||
| 481 | 20-21 | 25 | 46 | ||||||||||||||||
| 482 | 22-24 | 31 | 38 | ||||||||||||||||
| 483 | 25-29 | 36 | 55 | ||||||||||||||||
| 484 | 30-34 | 30 | 24 | ||||||||||||||||
| 485 | 35-39 | 15 | 23 | ||||||||||||||||
| 486 | 40-49 | 12 | 18 | ||||||||||||||||
| 487 | 50-64 | 8 | 17 | ||||||||||||||||
| 488 | 65 and Over | 1 | 1 | ||||||||||||||||
| 489 | Total | 193 | 270 | ||||||||||||||||
| 490 | |||||||||||||||||||
| 491 | Technical Site - Total | ||||||||||||||||||
| 492 | Less Than 18 | 6 | 28 | 27 | 86 | 39 | 33 | 550.0% | -47 | -54.7% | |||||||||
| 493 | 18-19 | 97 | 90 | 90 | 123 | 136 | 39 | 40.2% | 13 | 10.6% | |||||||||
| 494 | 20-21 | 77 | 103 | 87 | 99 | 95 | 18 | 23.4% | -4 | -4.0% | |||||||||
| 495 | 22-24 | 82 | 96 | 93 | 112 | 101 | 19 | 23.2% | -11 | -9.8% | |||||||||
| 496 | 25-29 | 107 | 135 | 112 | 156 | 140 | 33 | 30.8% | -16 | -10.3% | |||||||||
| 497 | 30-34 | 107 | 94 | 82 | 123 | 103 | -4 | -3.7% | -20 | -16.3% | |||||||||
| 498 | 35-39 | 53 | 51 | 56 | 58 | 56 | 3 | 5.7% | -2 | -3.4% | |||||||||
| 499 | 40-49 | 61 | 60 | 57 | 77 | 69 | 8 | 13.1% | -8 | -10.4% | |||||||||
| 500 | 50-64 | 48 | 62 | 47 | 33 | 46 | -2 | -4.2% | 13 | 39.4% | |||||||||
| 501 | 65 and Over | 1 | 3 | 2 | 2 | 1 | 0 | n/a | -1 | -50.0% | |||||||||
|---|---|---|---|---|---|---|---|---|---|---|---|---|---|---|---|---|---|---|---|
| 502 | Total | 639 | 722 | 653 | 869 | 786 | 147 | 23.0% | -83 | -9.6% | |||||||||
| 503 | |||||||||||||||||||
| 504 | |||||||||||||||||||
| 505 | Sidney Collier Site | ||||||||||||||||||
| 506 | Less Than 18 | 1 | 1 | 2 | 1 | 100.0% | |||||||||||||
| 507 | 18-19 | 31 | 57 | 38 | -19 | -33.3% | |||||||||||||
| 508 | 20-21 | 38 | 90 | 69 | -21 | -23.3% | |||||||||||||
| 509 | 22-24 | 41 | 102 | 87 | -15 | -14.7% | |||||||||||||
| 510 | 25-29 | 65 | 116 | 105 | -11 | -9.5% | |||||||||||||
| 511 | 30-34 | 50 | 89 | 91 | 2 | 2.2% | |||||||||||||
| 512 | 35-39 | 20 | 55 | 63 | 8 | 14.5% | |||||||||||||
| 513 | 40-49 | 31 | 51 | 50 | -1 | -2.0% | |||||||||||||
| 514 | 50-64 | 21 | 39 | 29 | -10 | -25.6% | |||||||||||||
| 515 | 65 and Over | 1 | 0 | 1 | 1 | n/a | |||||||||||||
| 516 | Total | 299 | 600 | 535 | -65 | -10.8% | |||||||||||||
| 517 | |||||||||||||||||||
| 518 | |||||||||||||||||||
| 519 | Spring Enrollment History 2013-2017 by Admission Status | ||||||||||||||||||
| 520 | |||||||||||||||||||
| 521 | |||||||||||||||||||
| 522 | Number | % | Number | % | |||||||||||||||
| 523 | College Wide | Change | Change | Change | Change | ||||||||||||||
| 524 | Admission Status | Spring | Spring | Spring | Spring | Spring | 2013 | 2013 | 2016 | 2016 | |||||||||
| 525 | 2013 | 2014 | 2015 | 2016 | 2017 | to 2017 | to 2017 | to 2017 | to 2017 | ||||||||||
| 526 | First-Time Freshmen | 1,420 | 1,026 | 1,051 | 880 | 655 | -765 | -53.9% | -225 | -25.6% | |||||||||
| 527 | Transfer Student | 1,475 | 1,293 | 1,083 | 1,243 | 1,107 | -368 | -24.9% | -136 | -10.9% | |||||||||
| 528 | Continuing Students | 12,784 | 11,993 | 11,736 | 10,904 | 9,692 | -3,092 | -24.2% | -1,212 | -11.1% | |||||||||
| 529 | Readmitted Students | 1,943 | 2,039 | 2,339 | 2,052 | 1,785 | -158 | -8.1% | -267 | -13.0% | |||||||||
| 530 | Exchange Students | 204 | 313 | 523 | 606 | 850 | 646 | 316.7% | 244 | 40.3% | |||||||||
| 531 | Other Students | 190 | 261 | 284 | 290 | 242 | 52 | 27.4% | -48 | -16.6% | |||||||||
| 532 | Total | 18,016 | 16,925 | 17,016 | 15,975 | 14,331 | -3,685 | -20.5% | -1,644 | -10.3% | |||||||||
| 533 | |||||||||||||||||||
| 534 | Percentages | ||||||||||||||||||
| 535 | First-Time Freshmen | 7.9% | 6.1% | 6.2% | 5.5% | 4.6% | |||||||||||||
| 536 | Transfer Student | 8.2% | 7.6% | 6.4% | 7.8% | 7.7% | |||||||||||||
| 537 | Continuing Students | 71.0% | 70.9% | 69.0% | 68.3% | 67.6% | |||||||||||||
| 538 | Readmitted Students | 10.8% | 12.0% | 13.7% | 12.8% | 12.5% | |||||||||||||
| 539 | Exchange Students | 1.1% | 1.8% | 3.1% | 3.8% | 5.9% | |||||||||||||
| 540 | Other Students | 1.1% | 1.5% | 1.7% | 1.8% | 1.7% | |||||||||||||
| 541 | |||||||||||||||||||
| 542 | |||||||||||||||||||
| 543 | |||||||||||||||||||
| 544 | |||||||||||||||||||
| 545 | 7/25/2017 | Office of Planning and Research | |||||||||||||||||
| 546 | |||||||||||||||||||
| 547 | Spring Enrollment History 2013-2017 by Admission Status | ||||||||||||||||||
| 548 | |||||||||||||||||||
| 549 |
|
||||||||||||||||||
| 550 | |||||||||||||||||||
| 551 | |||||||||||||||||||
| 552 | |||||||||||||||||||
| 553 | |||||||||||||||||||
| 554 | |||||||||||||||||||
| 555 | |||||||||||||||||||
| 556 | |||||||||||||||||||
| 557 | |||||||||||||||||||
| 558 | |||||||||||||||||||
| 559 | |||||||||||||||||||
| 560 | |||||||||||||||||||
| 561 | |||||||||||||||||||
| 562 | |||||||||||||||||||
| 563 | |||||||||||||||||||
| 564 | |||||||||||||||||||
| 565 | |||||||||||||||||||
| 566 | |||||||||||||||||||
| 567 | |||||||||||||||||||
| 568 | |||||||||||||||||||
| 569 | |||||||||||||||||||
| 570 | |||||||||||||||||||
| 571 | |||||||||||||||||||
| 572 | |||||||||||||||||||
| 573 | |||||||||||||||||||
| 574 | Spring Enrollment History 2013-2017 by Admission Status by Campus/Site | ||||||||||||||||||
| 575 | |||||||||||||||||||
| 576 | |||||||||||||||||||
| 577 | Number | % | Number | % | |||||||||||||||
| 578 | Change | Change | Change | Change | |||||||||||||||
| 579 | City Park Campus | Spring | Spring | Spring | Spring | Spring | 2013 | 2013 | 2016 | 2016 | |||||||||
| 580 | Admission Status | 2013 | 2014 | 2015 | 2016 | 2017 | to 2017 | to 2017 | to 2017 | to 2017 | |||||||||
| 581 | First-Time Freshmen | 779 | 625 | 659 | 541 | 430 | -349 | -44.8% | -111 | -20.5% | |||||||||
| 582 | Transfer Student | 923 | 914 | 728 | 823 | 834 | -89 | -9.6% | 11 | 1.3% | |||||||||
| 583 | Continuing Students | 7,884 | 7,386 | 7,468 | 6,565 | 6,680 | -1,204 | -15.3% | 115 | 1.8% | |||||||||
| 584 | Readmitted Students | 1,113 | 1,394 | 1,543 | 1,349 | 1,279 | 166 | 14.9% | -70 | -5.2% | |||||||||
| 585 | Exchange Students | 166 | 166 | 353 | 367 | 492 | 326 | 196.4% | 125 | 34.1% | |||||||||
| 586 | Other Students | 165 | 217 | 239 | 255 | 223 | 58 | 35% | -32 | -12.5% | |||||||||
| 587 | Total | 11,030 | 10,702 | 10,990 | 9,900 | 9,938 | -1,092 | -9.9% | 38 | 0.4% | |||||||||
| 588 | |||||||||||||||||||
| 589 | |||||||||||||||||||
| 590 | West Bank Campus | ||||||||||||||||||
| 591 | First-Time Freshmen | 248 | 171 | 165 | 131 | 129 | -119 | -48.0% | -2 | -1.5% | |||||||||
| 592 | Transfer Student | 230 | 137 | 122 | 155 | 130 | -100 | -43.5% | -25 | -16.1% | |||||||||
| 593 | Continuing Students | 2,080 | 1,863 | 1,813 | 1,666 | 1,567 | -513 | -24.7% | -99 | -5.9% | |||||||||
| 594 | Readmitted Students | 353 | 307 | 381 | 328 | 289 | -64 | -18.1% | -39 | -11.9% | |||||||||
| 595 | Exchange Students | 31 | 75 | 102 | 104 | 246 | 215 | 693.5% | 142 | 136.5% | |||||||||
| 596 | Other Students | 12 | 20 | 27 | 21 | 14 | 2 | 16.7% | -7 | -33.3% | |||||||||
| 597 | Total | 2,954 | 2,573 | 2,610 | 2,405 | 2,375 | -579 | -19.6% | -30 | -1.2% | |||||||||
| 598 | |||||||||||||||||||
| 599 | Charity School of Nursing | ||||||||||||||||||
| 600 | First-Time Freshmen | 0 | 0 | 0 | 0 | 1 | 1 | n/a | 1 | n/a | |||||||||
| 601 | Transfer Student | 18 | 11 | 15 | 17 | 29 | 11 | 61.1% | 12 | 70.6% | |||||||||
|---|---|---|---|---|---|---|---|---|---|---|---|---|---|---|---|---|---|---|---|
| 602 | Continuing Students | 566 | 638 | 621 | 604 | 587 | 21 | 3.7% | -17 | -2.8% | |||||||||
| 603 | Readmitted Students | 68 | 66 | 76 | 80 | 80 | 12 | 17.6% | 0 | 0.0% | |||||||||
| 604 | Exchange Students | 0 | 0 | 0 | 0 | 0 | 0 | n/a | 0 | n/a | |||||||||
| 605 | Other Students | 0 | 0 | 0 | 0 | 0 | 0 | n/a | 0 | n/a | |||||||||
| 606 | Total | 652 | 715 | 712 | 701 | 697 | 45 | 6.9% | -4 | -0.6% | |||||||||
| 607 | |||||||||||||||||||
| 608 | Northshore Site - Covington | ||||||||||||||||||
| 609 | First-Time Freshmen | 154 | 56 | ||||||||||||||||
| 610 | Transfer Student | 182 | 85 | ||||||||||||||||
| 611 | Continuing Students | 1,007 | 725 | ||||||||||||||||
| 612 | Readmitted Students | 127 | 70 | ||||||||||||||||
| 613 | Exchange Students | 5 | 7 | ||||||||||||||||
| 614 | Other Students | 6 | 5 | ||||||||||||||||
| 615 | Total | 1,481 | 948 | ||||||||||||||||
| 616 | |||||||||||||||||||
| 617 | |||||||||||||||||||
| 618 | |||||||||||||||||||
| 619 | 7/25/2017 | Office of Planning and Research | |||||||||||||||||
| 620 | |||||||||||||||||||
| 621 | Spring Enrollment History 2013-2017 by Admission Status (cont.) | ||||||||||||||||||
| 622 | |||||||||||||||||||
| 623 | |||||||||||||||||||
| 624 | Number | % | Number | % | |||||||||||||||
| 625 | Change | Change | Change | Change | |||||||||||||||
| 626 | Northshore Site - Slidell | Spring | Spring | Spring | Spring | Spring | 2013 | 2013 | 2016 | 2016 | |||||||||
| 627 | 2013 | 2014 | 2015 | 2016 | 2017 | to 2017 | to 2017 | to 2017 | to 2017 | ||||||||||
| 628 | First-Time Freshmen | 104 | 95 | 114 | 83 | ||||||||||||||
| 629 | Transfer Student | 135 | 107 | 143 | 154 | ||||||||||||||
| 630 | Continuing Students | 1,076 | 910 | 1,240 | 1,098 | ||||||||||||||
| 631 | Readmitted Students | 133 | 136 | 212 | 153 | ||||||||||||||
| 632 | Exchange Students | 5 | 12 | 32 | 3 | ||||||||||||||
| 633 | Other Students | 7 | 5 | 11 | 9 | ||||||||||||||
| 634 | Total | 1,460 | 1,265 | 1,752 | 1,500 | ||||||||||||||
| 635 | |||||||||||||||||||
| 636 | Northshore Site - Total | ||||||||||||||||||
| 637 | First-Time Freshmen | 296 | 151 | 114 | 83 | ||||||||||||||
| 638 | Transfer Student | 239 | 192 | 143 | 154 | ||||||||||||||
| 639 | Continuing Students | 1,863 | 1,635 | 1,240 | 1,098 | ||||||||||||||
| 640 | Readmitted Students | 339 | 206 | 212 | 153 | ||||||||||||||
| 641 | Exchange Students | 4 | 19 | 32 | 3 | ||||||||||||||
| 642 | Other Students | 0 | 10 | 11 | 9 | ||||||||||||||
| 643 | Total | 2,741 | 2,213 | 1,752 | 1,500 | ||||||||||||||
| 644 | |||||||||||||||||||
| 645 | Technical Site - Jefferson | ||||||||||||||||||
| 646 | First-Time Freshmen | 56 | 48 | 69 | 72 | 56 | 0 | 0.0% | -16 | -22.2% | |||||||||
| 647 | Transfer Student | 49 | 30 | 52 | 57 | 65 | 16 | 32.7% | 8 | 14.0% | |||||||||
| 648 | Continuing Students | 272 | 305 | 420 | 531 | 485 | 213 | 78.3% | -46 | -8.7% | |||||||||
| 649 | Readmitted Students | 55 | 38 | 69 | 73 | 66 | 11 | 20.0% | -7 | -9.6% | |||||||||
| 650 | Exchange Students | 3 | 25 | 36 | 131 | 109 | 106 | 3533.3% | -22 | -16.8% | |||||||||
| 651 | Other Students | 11 | 6 | 7 | 5 | 5 | -6 | -54.5% | 0 | 0.0% | |||||||||
|---|---|---|---|---|---|---|---|---|---|---|---|---|---|---|---|---|---|---|---|
| 652 | Total | 446 | 452 | 653 | 869 | 786 | 340 | 76.2% | -83 | -9.6% | |||||||||
| 653 | |||||||||||||||||||
| 654 | Technical Site - West Jefferson | ||||||||||||||||||
| 655 | First-Time Freshmen | 41 | 31 | ||||||||||||||||
| 656 | Transfer Student | 16 | 9 | ||||||||||||||||
| 657 | Continuing Students | 119 | 166 | ||||||||||||||||
| 658 | Readmitted Students | 15 | 28 | ||||||||||||||||
| 659 | Exchange Students | 0 | 28 | ||||||||||||||||
| 660 | Other Students | 2 | 8 | ||||||||||||||||
| 661 | Total | 193 | 270 | ||||||||||||||||
| 662 | |||||||||||||||||||
| 663 | Technical Site - Total | ||||||||||||||||||
| 664 | First-Time Freshmen | 97 | 79 | 69 | 72 | 56 | -41 | -42.3% | -16 | -22.2% | |||||||||
| 665 | Transfer Student | 65 | 39 | 52 | 57 | 65 | 0 | 0.0% | 8 | 14.0% | |||||||||
| 666 | Continuing Students | 391 | 471 | 420 | 531 | 485 | 94 | 24.0% | -46 | -8.7% | |||||||||
| 667 | Readmitted Students | 70 | 66 | 69 | 73 | 66 | -4 | -5.7% | -7 | -9.6% | |||||||||
| 668 | Exchange Students | 3 | 53 | 36 | 131 | 109 | 106 | 3533.3% | -22 | -16.8% | |||||||||
| 669 | Other Students | 13 | 14 | 7 | 5 | 5 | -8 | -61.5% | 0 | 0.0% | |||||||||
| 670 | Total | 639 | 722 | 653 | 869 | 786 | 147 | 23.0% | -83 | -9.6% | |||||||||
| 671 | |||||||||||||||||||
| 672 | Sidney Collier Site | ||||||||||||||||||
| 673 | First-Time Freshmen | 44 | 53 | 39 | -14 | -26.4% | |||||||||||||
| 674 | Transfer Student | 23 | 37 | 49 | 12 | 32.4% | |||||||||||||
| 675 | Continuing Students | 174 | 440 | 373 | -67 | -15.2% | |||||||||||||
| 676 | Readmitted Students | 58 | 69 | 71 | 2 | 2.9% | |||||||||||||
| 677 | Exchange Students | 0 | 1 | 3 | 2 | 200.0% | |||||||||||||
| 678 | Other Students | 0 | 0 | 0 | 0 | n/a | |||||||||||||
| 679 | Total | 299 | 600 | 535 | -65 | -10.8% | |||||||||||||
| 680 | |||||||||||||||||||
| 681 | |||||||||||||||||||
| 682 | |||||||||||||||||||
| 683 | 7/25/2017 | Office of Planning and Research | |||||||||||||||||
| 684 | |||||||||||||||||||
| 685 | Spring Enrollment History 2013-2017 by Classification | ||||||||||||||||||
| 686 | |||||||||||||||||||
| 687 | |||||||||||||||||||
| 688 | |||||||||||||||||||
| 689 | Number | % | Number | % | |||||||||||||||
| 690 | College Wide | Change | Change | Change | Change | ||||||||||||||
| 691 | Classification | Spring | Spring | Spring | Spring | Spring | 2013 | 2013 | 2016 | 2016 | |||||||||
| 692 | 2013 | 2014 | 2015 | 2016 | 2017 | to 2017 | to 2017 | to 2017 | to 2017 | ||||||||||
| 693 | Freshmen | 9,481 | 8,162 | 6,988 | 6,014 | 4,737 | -4,744 | -50.0% | -1,277 | -21.2% | |||||||||
| 694 | Sophomores | 4,218 | 3,751 | 4,791 | 4,499 | 3,924 | -294 | -7.0% | -575 | -12.8% | |||||||||
| 695 | Other Undergraduates | 4,192 | 4,766 | 4,813 | 4,925 | 4,888 | 696 | 16.6% | -37 | -0.8% | |||||||||
| 696 | Preparatory | 125 | 246 | 424 | 537 | 782 | 657 | 525.6% | 245 | 45.6% | |||||||||
| 697 | Total | 18,016 | 16,925 | 17,016 | 15,975 | 14,331 | -3,685 | -20.5% | -1,644 | -10.3% | |||||||||
| 698 | |||||||||||||||||||
| 699 | Percentages | ||||||||||||||||||
| 700 | Freshmen | 52.6% | 48.2% | 41.1% | 37.6% | 33.1% | |||||||||||||
| 701 | Sophomores | 23.4% | 22.2% | 28.2% | 28.2% | 27.4% | |||||||||||||
|---|---|---|---|---|---|---|---|---|---|---|---|---|---|---|---|---|---|---|---|
| 702 | Other Undergraduates | 23.3% | 28.2% | 28.3% | 30.8% | 34.1% | |||||||||||||
| 703 | Preparatory | 0.7% | 1.5% | 2.5% | 3.4% | 5.5% | |||||||||||||
| 704 | |||||||||||||||||||
| 705 | |||||||||||||||||||
| 706 | Spring Enrollment History 2013-2017 Classification by Campus | ||||||||||||||||||
| 707 | |||||||||||||||||||
| 708 | |||||||||||||||||||
| 709 | Number | % | Number | % | |||||||||||||||
| 710 | Change | Change | Change | Change | |||||||||||||||
| 711 | City Park Campus | Spring | Spring | Spring | Spring | Spring | 2013 | 2013 | 2016 | 2016 | |||||||||
| 712 | Classification | 2013 | 2014 | 2015 | 2016 | 2017 | to 2017 | to 2017 | to 2017 | to 2017 | |||||||||
| 713 | Freshmen | 5,525 | 5,242 | 4,582 | 3,820 | 3,302 | -2,223 | -40.2% | -518 | -13.6% | |||||||||
| 714 | Sophomores | 2,589 | 2,346 | 3,118 | 2,887 | 2,879 | 290 | 11.2% | -8 | -0.3% | |||||||||
| 715 | Other Undergraduates | 2,822 | 2,993 | 3,011 | 2,881 | 3,327 | 505 | 17.9% | 446 | 15.5% | |||||||||
| 716 | Preparatory | 94 | 121 | 279 | 312 | 430 | 336 | 357.4% | 118 | 37.8% | |||||||||
| 717 | Total | 11,030 | 10,702 | 10,990 | 9,900 | 9,938 | -1,092 | -9.9% | 38 | 0.4% | |||||||||
| 718 | |||||||||||||||||||
| 719 | |||||||||||||||||||
| 720 | West Bank Campus | ||||||||||||||||||
| 721 | Freshmen | 1,664 | 1,278 | 1,121 | 971 | 918 | -746 | -44.8% | -53 | -5.5% | |||||||||
| 722 | Sophomores | 781 | 647 | 796 | 721 | 655 | -126 | -16.1% | -66 | -9.2% | |||||||||
| 723 | Other Undergraduates | 482 | 580 | 606 | 618 | 560 | 78 | 16.2% | -58 | -9.4% | |||||||||
| 724 | Preparatory | 27 | 68 | 87 | 95 | 242 | 215 | 796.3% | 147 | 154.7% | |||||||||
| 725 | Total | 2,954 | 2,573 | 2,610 | 2,405 | 2,375 | -579 | -19.6% | -30 | -1.2% | |||||||||
| 726 | |||||||||||||||||||
| 727 | |||||||||||||||||||
| 728 | Charity School of Nursing | ||||||||||||||||||
| 729 | Freshmen | 20 | 11 | 1 | 9 | 11 | -9 | -45.0% | 2 | 22.2% | |||||||||
| 730 | Sophomores | 124 | 51 | 44 | 56 | 63 | -61 | -49.2% | 7 | 12.5% | |||||||||
| 731 | Other Undergraduates | 508 | 653 | 667 | 636 | 623 | 115 | 22.6% | -13 | -2.0% | |||||||||
| 732 | Preparatory | 0 | 0 | 0 | 0 | 0 | 0 | n/a | 0 | n/a | |||||||||
| 733 | Total | 652 | 715 | 712 | 701 | 697 | 45 | 6.9% | -4 | -0.6% | |||||||||
| 734 | |||||||||||||||||||
| 735 | Northshore Site - Covington | ||||||||||||||||||
| 736 | Freshmen | 893 | 508 | ||||||||||||||||
| 737 | Sophomores | 375 | 243 | ||||||||||||||||
| 738 | Other Undergraduates | 211 | 195 | ||||||||||||||||
| 739 | Preparatory | 2 | 2 | ||||||||||||||||
| 740 | Total | 1,481 | 948 | ||||||||||||||||
| 741 | |||||||||||||||||||
| 742 | Northshore Site - Slidell | ||||||||||||||||||
| 743 | Freshmen | 954 | 711 | 768 | 636 | ||||||||||||||
| 744 | Sophomores | 337 | 318 | 603 | 507 | ||||||||||||||
| 745 | Other Undergraduates | 166 | 231 | 357 | 356 | ||||||||||||||
| 746 | Preparatory | 3 | 5 | 24 | 1 | ||||||||||||||
| 747 | Total | 1,460 | 1,265 | 1,752 | 1,500 | ||||||||||||||
| 748 | |||||||||||||||||||
| 749 | Northshore Site - Total | ||||||||||||||||||
| 750 | Freshmen | 1,828 | 1,219 | 768 | 636 | ||||||||||||||
| 751 | Sophomores | 593 | 561 | 603 | 507 | ||||||||||||||
|---|---|---|---|---|---|---|---|---|---|---|---|---|---|---|---|---|---|---|---|
| 752 | Other Undergraduates | 316 | 426 | 357 | 356 | ||||||||||||||
| 753 | Preparatory | 4 | 7 | 24 | 1 | ||||||||||||||
| 754 | Total | 2,741 | 2,213 | 1,752 | 1,500 | ||||||||||||||
| 755 | |||||||||||||||||||
| 756 | |||||||||||||||||||
| 757 | |||||||||||||||||||
| 758 | 7/25/2017 | Office of Planning and Research | |||||||||||||||||
| 759 | |||||||||||||||||||
| 760 | Spring Enrollment History 2013-2017 Classification by Campus (cont.) | ||||||||||||||||||
| 761 | |||||||||||||||||||
| 762 | Number | % | Number | % | |||||||||||||||
| 763 | Change | Change | Change | Change | |||||||||||||||
| 764 | Technical Site - Jefferson | Spring | Spring | Spring | Spring | Spring | 2013 | 2013 | 2016 | 2016 | |||||||||
| 765 | Classification | 2013 | 2014 | 2015 | 2016 | 2017 | to 2017 | to 2017 | to 2017 | to 2017 | |||||||||
| 766 | Freshmen | 298 | 262 | 340 | 329 | 286 | -12 | -4.0% | -43 | -13.1% | |||||||||
| 767 | Sophomores | 101 | 86 | 159 | 171 | 170 | 69 | 68.3% | -1 | -0.6% | |||||||||
| 768 | Other Undergraduates | 47 | 82 | 120 | 241 | 223 | 176 | 374.5% | -18 | -7.5% | |||||||||
| 769 | Preparatory | 0 | 22 | 34 | 128 | 107 | 107 | n/a | -21 | -16.4% | |||||||||
| 770 | Total | 446 | 452 | 653 | 869 | 786 | 340 | 76.2% | -83 | -9.6% | |||||||||
| 771 | |||||||||||||||||||
| 772 | Technical Site - West Jefferson | ||||||||||||||||||
| 773 | Freshmen | 146 | 150 | ||||||||||||||||
| 774 | Sophomores | 30 | 60 | ||||||||||||||||
| 775 | Other Undergraduates | 17 | 32 | ||||||||||||||||
| 776 | Preparatory | 0 | 28 | ||||||||||||||||
| 777 | Total | 193 | 270 | ||||||||||||||||
| 778 | |||||||||||||||||||
| 779 | Technical Site - Total | ||||||||||||||||||
| 780 | Freshmen | 444 | 412 | 340 | 329 | 286 | -158 | -35.6% | -43 | -13.1% | |||||||||
| 781 | Sophomores | 131 | 146 | 159 | 171 | 170 | 39 | 29.8% | -1 | -0.6% | |||||||||
| 782 | Other Undergraduates | 64 | 114 | 120 | 241 | 223 | 159 | 248.4% | -18 | -7.5% | |||||||||
| 783 | Preparatory | 0 | 50 | 34 | 128 | 107 | 107 | n/a | -21 | -16.4% | |||||||||
| 784 | Total | 639 | 722 | 653 | 869 | 786 | 147 | 23.0% | -83 | -9.6% | |||||||||
| 785 | |||||||||||||||||||
| 786 | |||||||||||||||||||
| 787 | Sidney Collier Site | ||||||||||||||||||
| 788 | Freshmen | 176 | 249 | 220 | -29 | -11.6% | |||||||||||||
| 789 | Sophomores | 71 | 157 | 157 | 0 | 0.0% | |||||||||||||
| 790 | Other Undergraduates | 52 | 193 | 155 | -38 | -19.7% | |||||||||||||
| 791 | Preparatory | 0 | 1 | 3 | 2 | 200.0% | |||||||||||||
| 792 | Total | 299 | 600 | 535 | -65 | -10.8% | |||||||||||||
| 793 | |||||||||||||||||||
| 794 | |||||||||||||||||||
| 795 | |||||||||||||||||||
| 796 | Spring Enrollment History 2013-2017 by | ||||||||||||||||||
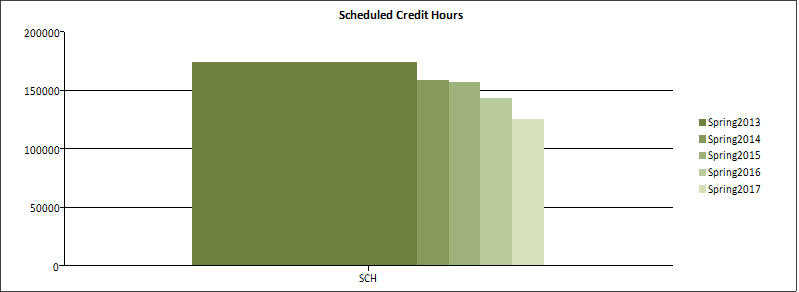
| 797 | Enrollment Status, Headcount, FTE, SCH | ||||||||||||||||||
| 798 | |||||||||||||||||||
| 799 | |||||||||||||||||||
| 800 | Number | % | Number | % | |||||||||||||||
| 801 | College Wide | Change | Change | Change | Change | ||||||||||||||
|---|---|---|---|---|---|---|---|---|---|---|---|---|---|---|---|---|---|---|---|
| 802 | Spring | Spring | Spring | Spring | Spring | 2013 | 2013 | 2016 | 2016 | ||||||||||
| 803 | 2013 | 2014 | 2015 | 2016 | 2017 | to 2017 | to 2017 | to 2017 | to 2017 | ||||||||||
| 804 | Full Time | 8,016 | 6,643 | 6,330 | 5,902 | 5,065 | -2,951 | -36.8% | -837 | -14.2% | |||||||||
| 805 | Part Time | 10,310 | 10,282 | 10,686 | 10,073 | 9,266 | -1,044 | -10.1% | -807 | -8.0% | |||||||||
| 806 | Headcount | 18,326 | 16,925 | 17,016 | 15,975 | 14,331 | -3,995 | -21.8% | -1,644 | -10.3% | |||||||||
| 807 | SCH | 174,654 | 159,564 | 157,360 | 142,668 | 125,844 | -48,810 | -27.9% | -16,824 | -11.8% | |||||||||
| 808 | *FTE Funding (based on 15 SCH) | 11,644 | 10,638 | 10,491 | 9,511 | 8,390 | -3,254 | -27.9% | -1,122 | -11.8% | |||||||||
| 809 | *FTE Other (based on 12 SCH) | 14,555 | 13,297 | 13,113 | 11,889 | 10,487 | -4,068 | -27.9% | -1,402 | -11.8% | |||||||||
| 810 | *FTE: Full-time equivalent. | ||||||||||||||||||
| 811 | Percentages | ||||||||||||||||||
| 812 | Full Time | 43.7% | 39.2% | 37.2% | 36.9% | 35.3% | |||||||||||||
| 813 | Part Time | 56.3% | 60.8% | 62.8% | 63.1% | 64.7% | |||||||||||||
| 814 | |||||||||||||||||||
| 815 |
|
||||||||||||||||||
| 816 | |||||||||||||||||||
| 817 | |||||||||||||||||||
| 818 | |||||||||||||||||||
| 819 | |||||||||||||||||||
| 820 | |||||||||||||||||||
| 821 | |||||||||||||||||||
| 822 | |||||||||||||||||||
| 823 | |||||||||||||||||||
| 824 | |||||||||||||||||||
| 825 | |||||||||||||||||||
| 826 | |||||||||||||||||||
| 827 | |||||||||||||||||||
| 828 | |||||||||||||||||||
| 829 | |||||||||||||||||||
| 830 | |||||||||||||||||||
| 831 | |||||||||||||||||||
| 832 | |||||||||||||||||||
| 833 | |||||||||||||||||||
| 834 | |||||||||||||||||||
| 835 | |||||||||||||||||||
| 836 | |||||||||||||||||||
| 837 | 7/25/2017 | Office of Planning and Research | |||||||||||||||||
| 838 | |||||||||||||||||||
| 839 | Spring Enrollment History 2013-2017 by | ||||||||||||||||||
| 840 | Enrollment Status, Headcount, FTE, SCH | ||||||||||||||||||
| 841 | |||||||||||||||||||
| 842 | |||||||||||||||||||
| 843 |
|
||||||||||||||||||
| 844 | |||||||||||||||||||
| 845 | |||||||||||||||||||
| 846 | |||||||||||||||||||
| 847 | |||||||||||||||||||
| 848 | |||||||||||||||||||
| 849 | |||||||||||||||||||
| 850 | |||||||||||||||||||
| 851 | |||||||||||||||||||
| 852 | |||||||||||||||||||
| 853 | |||||||||||||||||||
| 854 | |||||||||||||||||||
| 855 | |||||||||||||||||||
| 856 | |||||||||||||||||||
| 857 | |||||||||||||||||||
| 858 | |||||||||||||||||||
| 859 | |||||||||||||||||||
| 860 | |||||||||||||||||||
| 861 | |||||||||||||||||||
| 862 | |||||||||||||||||||
| 863 | |||||||||||||||||||
| 864 | Number | % | Number | % | |||||||||||||||
| 865 | Change | Change | Change | Change | |||||||||||||||
| 866 | City Park Campus | Spring | Spring | Spring | Spring | Spring | 2013 | 2013 | 2016 | 2016 | |||||||||
| 867 | 2013 | 2014 | 2015 | 2016 | 2017 | to 2017 | to 2017 | to 2017 | to 2017 | ||||||||||
| 868 | Full Time | 4,865 | 4,296 | 4,271 | 3,435 | 3,364 | -1,501 | -30.9% | -71 | -2.1% | |||||||||
| 869 | Part Time | 6,165 | 6,406 | 6,719 | 6,465 | 6,574 | 409 | 6.6% | 109 | 1.7% | |||||||||
| 870 | Headcount | 11,030 | 10,702 | 10,990 | 9,900 | 9,938 | -1,092 | -9.9% | 38 | 0.4% | |||||||||
| 871 | SCH | 105,659 | 100,754 | 101,765 | 88,005 | 87,478 | -18,181 | -17.2% | -527 | -0.6% | |||||||||
| 872 | FTE Funding (based on 15 SCH) | 7,044 | 6,717 | 6,784 | 5,867 | 5,832 | -1,212 | -17.2% | -35 | -0.6% | |||||||||
| 873 | FTE Other (based on 12 SCH) | 8,805 | 8,396 | 8,480 | 7,334 | 7,290 | -1,515 | -17.2% | -44 | -0.6% | |||||||||
| 874 | |||||||||||||||||||
| 875 | |||||||||||||||||||
| 876 | West Bank Campus | ||||||||||||||||||
| 877 | Full Time | 1,282 | 1,065 | 998 | 860 | 738 | -544 | -42.4% | -122 | -14.2% | |||||||||
| 878 | Part Time | 1,672 | 1,508 | 1,612 | 1,545 | 1,637 | -35 | -2.1% | 92 | 6.0% | |||||||||
| 879 | Headcount | 2,954 | 2,573 | 2,610 | 2,405 | 2,375 | -579 | -19.6% | -30 | -1.2% | |||||||||
| 880 | SCH | 27,648 | 23,783 | 23,570 | 21,141 | 20,223 | -7,425 | -26.9% | -918 | -4.3% | |||||||||
| 881 | FTE Funding (based on 15 SCH) | 1,843 | 1,586 | 1,571 | 1,409 | 1,348 | -495 | -26.9% | -61 | -4.3% | |||||||||
| 882 | FTE Other (based on 12 SCH) | 2,304 | 1,982 | 1,964 | 1,762 | 1,685 | -619 | -26.9% | -77 | -4.3% | |||||||||
| 883 | |||||||||||||||||||
| 884 | |||||||||||||||||||
| 885 | Charity School of Nursing | ||||||||||||||||||
| 886 | Full Time | 201 | 85 | 60 | 562 | 546 | 345 | 171.6% | -16 | -2.8% | |||||||||
| 887 | Part Time | 451 | 630 | 652 | 139 | 151 | -300 | -66.5% | 12 | 8.6% | |||||||||
| 888 | Headcount | 652 | 715 | 712 | 701 | 697 | 45 | 6.9% | -4 | -0.6% | |||||||||
| 889 | SCH | 6,973 | 7,359 | 7,087 | 6,469 | 6,302 | -671 | -9.6% | -167 | -2.6% | |||||||||
| 890 | FTE Funding (based on 15 SCH) | 465 | 491 | 472 | 431 | 420 | -45 | -9.6% | -11 | -2.6% | |||||||||
| 891 | FTE Other (based on 12 SCH) | 581 | 613 | 591 | 539 | 525 | -56 | -9.6% | -14 | -2.6% | |||||||||
| 892 | |||||||||||||||||||
| 893 | |||||||||||||||||||
| 894 | Northshore Site - Covington | ||||||||||||||||||
| 895 | Full Time | 669 | 404 | ||||||||||||||||
| 896 | Part Time | 812 | 544 | ||||||||||||||||
| 897 | Headcount | 1,481 | 948 | ||||||||||||||||
| 898 | SCH | 14,179 | 8,883 | ||||||||||||||||
| 899 | FTE Funding (based on 15 SCH) | 945 | 592 | ||||||||||||||||
| 900 | FTE Other (based on 12 SCH) | 1,182 | 740 | ||||||||||||||||
| 901 | |||||||||||||||||||
|---|---|---|---|---|---|---|---|---|---|---|---|---|---|---|---|---|---|---|---|
| 902 | Northshore Site - Slidell | ||||||||||||||||||
| 903 | Full Time | 633 | 524 | 645 | 577 | ||||||||||||||
| 904 | Part Time | 827 | 741 | 1,107 | 923 | ||||||||||||||
| 905 | Headcount | 1,460 | 1,265 | 1,752 | 1,500 | ||||||||||||||
| 906 | SCH | 13,728 | 11,904 | 15,842 | 13,739 | ||||||||||||||
| 907 | FTE Funding (based on 15 SCH) | 915 | 794 | 1,056 | 916 | ||||||||||||||
| 908 | FTE Other (based on 12 SCH) | 1,144 | 992 | 1,320 | 1,145 | ||||||||||||||
| 909 | |||||||||||||||||||
| 910 | |||||||||||||||||||
| 911 | |||||||||||||||||||
| 912 | 7/25/2017 | Office of Planning and Research | |||||||||||||||||
| 913 | |||||||||||||||||||
| 914 | Spring Enrollment History 2013-2017 by | ||||||||||||||||||
| 915 | Enrollment Status, Headcount, FTE, SCH (cont.) | ||||||||||||||||||
| 916 | |||||||||||||||||||
| 917 | Number | % | Number | % | |||||||||||||||
| 918 | Change | Change | Change | Change | |||||||||||||||
| 919 | Northshore Site - Total | Spring | Spring | Spring | Spring | Spring | 2013 | 2013 | 2016 | 2016 | |||||||||
| 920 | 2013 | 2014 | 2015 | 2016 | 2017 | to 2017 | to 2017 | to 2017 | to 2017 | ||||||||||
| 921 | Full Time | 1,387 | 928 | 645 | 577 | ||||||||||||||
| 922 | Part Time | 1,354 | 1,285 | 1,107 | 923 | ||||||||||||||
| 923 | Headcount | 2,741 | 2,213 | 1,752 | 1,500 | ||||||||||||||
| 924 | SCH | 26,960 | 20,787 | 15,842 | 13,739 | ||||||||||||||
| 925 | FTE Funding (based on 15 SCH) | 1,797 | 1,386 | 1,056 | 916 | ||||||||||||||
| 926 | FTE Other (based on 12 SCH) | 2,247 | 1,732 | 1,320 | 1,145 | ||||||||||||||
| 927 | |||||||||||||||||||
| 928 | Technical Site - Jefferson | ||||||||||||||||||
| 929 | Full Time | 188 | 163 | 198 | 282 | 228 | 40 | 21.3% | -54 | -19.1% | |||||||||
| 930 | Part Time | 258 | 289 | 455 | 587 | 558 | 300 | 116.3% | -29 | -4.9% | |||||||||
| 931 | Headcount | 446 | 452 | 653 | 869 | 786 | 340 | 76.2% | -83 | -9.6% | |||||||||
| 932 | SCH | 4,208 | 4,094 | 5,764 | 7,652 | 6,761 | 2,553 | 60.7% | -891 | -11.6% | |||||||||
| 933 | FTE Funding (based on 15 SCH) | 281 | 273 | 384 | 510 | 451 | 170 | 60.7% | -59 | -11.6% | |||||||||
| 934 | FTE Other (based on 12 SCH) | 351 | 341 | 480 | 638 | 563 | 213 | 60.7% | -74 | -11.6% | |||||||||
| 935 | |||||||||||||||||||
| 936 | Technical Site - West Jefferson | ||||||||||||||||||
| 937 | Full Time | 115 | 106 | ||||||||||||||||
| 938 | Part Time | 78 | 164 | ||||||||||||||||
| 939 | Headcount | 193 | 270 | ||||||||||||||||
| 940 | SCH | 2,194 | 2,787 | ||||||||||||||||
| 941 | FTE Funding (based on 15 SCH) | 146 | 186 | ||||||||||||||||
| 942 | FTE Other (based on 12 SCH) | 183 | 232 | ||||||||||||||||
| 943 | |||||||||||||||||||
| 944 | Technical Site - Total | ||||||||||||||||||
| 945 | Full Time | 281 | 269 | 198 | 282 | 228 | -54 | -19.1% | |||||||||||
| 946 | Part Time | 668 | 453 | 455 | 587 | 558 | -29 | -4.9% | |||||||||||
| 947 | Headcount | 949 | 722 | 653 | 869 | 786 | -83 | -9.6% | |||||||||||
| 948 | SCH | 7,414 | 6,881 | 5,764 | 7,652 | 6,761 | -891 | -11.6% | |||||||||||
| 949 | FTE Funding (based on 15 SCH) | 494 | 459 | 384 | 510 | 451 | -59 | -11.6% | |||||||||||
| 950 | FTE Other (based on 12 SCH) | 618 | 573 | 480 | 638 | 563 | -74 | -11.6% | |||||||||||
| 951 | |||||||||||||||||||
|---|---|---|---|---|---|---|---|---|---|---|---|---|---|---|---|---|---|---|---|
| 952 | Sidney Collier Site | ||||||||||||||||||
| 953 | Full Time | 158 | 186 | 189 | 3 | 1.6% | |||||||||||||
| 954 | Part Time | 141 | 414 | 346 | -68 | -16.4% | |||||||||||||
| 955 | Headcount | 299 | 600 | 535 | -65 | -10.8% | |||||||||||||
| 956 | SCH | 3,332 | 5,662 | 5,080 | -582 | -10.3% | |||||||||||||
| 957 | FTE Funding (based on 15 SCH) | 222 | 377 | 339 | -39 | -10.3% | |||||||||||||
| 958 | FTE Other (based on 12 SCH) | 278 | 472 | 423 | -49 | -10.3% | |||||||||||||
| 959 | |||||||||||||||||||
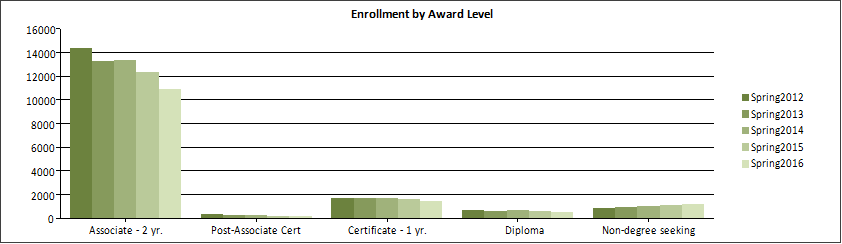
| 960 | Spring Enrollment History 2013-2017 by Award Sought | ||||||||||||||||||
| 961 | |||||||||||||||||||
| 962 | Number | % | Number | % | |||||||||||||||
| 963 | College Wide | Change | Change | Change | Change | ||||||||||||||
| 964 | Award | Spring | Spring | Spring | Spring | Spring | 2013 | 2013 | 2016 | 2016 | |||||||||
| 965 | 2013 | 2014 | 2015 | 2016 | 2017 | to 2017 | to 2017 | to 2017 | to 2017 | ||||||||||
| 966 | Associate - 2 yr. | 14,344 | 13,326 | 13,367 | 12,347 | 10,925 | -3,419 | -23.8% | -1,422 | -11.5% | |||||||||
| 967 | Post-Associate Cert | 339 | 314 | 242 | 207 | 189 | -150 | -44.2% | -18 | -8.7% | |||||||||
| 968 | Certificate - 1 yr. | 1,725 | 1,688 | 1,718 | 1,674 | 1,455 | -270 | -15.7% | -219 | -13.1% | |||||||||
| 969 | Diploma | 712 | 616 | 659 | 639 | 541 | -171 | -24.0% | -98 | -15.3% | |||||||||
| 970 | Non-degree seeking | 896 | 981 | 1,030 | 1,108 | 1,220 | 324 | 36.2% | 112 | 10.1% | |||||||||
| 971 | Total | 18,016 | 16,925 | 17,016 | 15,975 | 14,330 | -3,686 | -20.5% | -1,645 | -10.3% | |||||||||
| 972 | Percentages | ||||||||||||||||||
| 973 | Associate - 2 yr. | 79.6% | 78.7% | 78.6% | 77.3% | 76.2% | |||||||||||||
| 974 | Post-Associate Cert | 1.9% | 1.9% | 1.4% | 1.3% | 1.3% | |||||||||||||
| 975 | Certificate - 1 yr. | 9.6% | 10.0% | 10.1% | 10.5% | 10.2% | |||||||||||||
| 976 | Diploma | 4.0% | 3.6% | 3.9% | 4.0% | 3.8% | |||||||||||||
| 977 | Non-degree seeking | 5.0% | 5.8% | 6.1% | 6.9% | 8.5% | |||||||||||||
| 978 |
|
||||||||||||||||||
| 979 | |||||||||||||||||||
| 980 | |||||||||||||||||||
| 981 | |||||||||||||||||||
| 982 | |||||||||||||||||||
| 983 | |||||||||||||||||||
| 984 | |||||||||||||||||||
| 985 | |||||||||||||||||||
| 986 | |||||||||||||||||||
| 987 | |||||||||||||||||||
| 988 | |||||||||||||||||||
| 989 | |||||||||||||||||||
| 990 | |||||||||||||||||||
| 991 | |||||||||||||||||||
| 992 | |||||||||||||||||||
| 993 | |||||||||||||||||||
| 994 | 7/25/2017 | Office of Planning and Research | |||||||||||||||||
| 995 | |||||||||||||||||||
| 996 | Spring Enrollment History 2013-2017 by Award Sought | ||||||||||||||||||
| 997 | |||||||||||||||||||
| 998 | Number | % | Number | % | |||||||||||||||
| 999 | Change | Change | Change | Change | |||||||||||||||
| 1000 | City Park Campus | Spring | Spring | Spring | Spring | Spring | 2013 | 2013 | 2016 | 2016 | |||||||||
| 1001 | Award | 2013 | 2014 | 2015 | 2016 | 2017 | to 2017 | to 2017 | to 2017 | to 2017 | |||||||||
|---|---|---|---|---|---|---|---|---|---|---|---|---|---|---|---|---|---|---|---|
| 1002 | Associate - 2 yr. | 8,729 | 8,528 | 8,763 | 7,872 | 7,994 | -735 | -8.4% | 122 | 1.5% | |||||||||
| 1003 | Post-Associate Cert | 232 | 222 | 179 | 143 | 144 | -88 | -37.9% | 1 | 0.7% | |||||||||
| 1004 | Certificate - 1 yr. | 1,072 | 1,054 | 1,066 | 899 | 855 | -217 | -20.2% | -44 | -4.9% | |||||||||
| 1005 | Diploma | 213 | 180 | 195 | 185 | 116 | -97 | -45.5% | -69 | -37.3% | |||||||||
| 1006 | Non-degree seeking | 784 | 718 | 787 | 801 | 829 | 45 | 5.7% | 28 | 3.5% | |||||||||
| 1007 | Total | 11,030 | 10,702 | 10,990 | 9,900 | 9,938 | -1,092 | -9.9% | 38 | 0.4% | |||||||||
| 1008 | |||||||||||||||||||
| 1009 | West Bank Campus | ||||||||||||||||||
| 1010 | Associate - 2 yr. | 2,482 | 2,112 | 2,130 | 1,949 | 1,805 | -677 | -27.3% | -144 | -7.4% | |||||||||
| 1011 | Post-Associate Cert | 37 | 24 | 21 | 20 | 27 | -10 | -27.0% | 7 | 35.0% | |||||||||
| 1012 | Certificate - 1 yr. | 278 | 221 | 224 | 198 | 169 | -109 | -39.2% | -29 | -14.6% | |||||||||
| 1013 | Diploma | 85 | 67 | 84 | 86 | 103 | 18 | 21.2% | 17 | 19.8% | |||||||||
| 1014 | Non-degree seeking | 72 | 149 | 151 | 152 | 271 | 199 | 276.4% | 119 | 78.3% | |||||||||
| 1015 | Total | 2,954 | 2,573 | 2,610 | 2,405 | 2,375 | -579 | -19.6% | -30 | -1.2% | |||||||||
| 1016 | |||||||||||||||||||
| 1017 | Charity School of Nursing | ||||||||||||||||||
| 1018 | Associate - 2 yr. | 554 | 618 | 644 | 605 | 615 | 61 | 11.0% | 10 | 1.7% | |||||||||
| 1019 | Post-Associate Cert | 0 | 0 | 0 | 13 | 9 | 9 | n/a | -4 | -30.8% | |||||||||
| 1020 | Diploma | 98 | 97 | 68 | 0 | 0 | -98 | -100.0% | 0 | n/a | |||||||||
| 1021 | Certificate - 1 yr. | 0 | 0 | 0 | 83 | 73 | 73 | n/a | -10 | -12.0% | |||||||||
| 1022 | Total | 652 | 715 | 712 | 701 | 697 | 45 | 6.9% | -4 | -0.6% | |||||||||
| 1023 | |||||||||||||||||||
| 1024 | Northshore Site - Covington | ||||||||||||||||||
| 1025 | Associate - 2 yr. | 1,249 | 811 | ||||||||||||||||
| 1026 | Post-Associate Cert | 35 | 31 | ||||||||||||||||
| 1027 | Certificate - 1 yr. | 132 | 71 | ||||||||||||||||
| 1028 | Diploma | 41 | 16 | ||||||||||||||||
| 1029 | Non-degree seeking | 24 | 19 | ||||||||||||||||
| 1030 | Total | 1,481 | 948 | ||||||||||||||||
| 1031 | |||||||||||||||||||
| 1032 | Northshore Site - Slidell | ||||||||||||||||||
| 1033 | Associate - 2 yr. | 1,284 | 1,109 | 1,553 | 1,352 | ||||||||||||||
| 1034 | Post-Associate Cert | 30 | 28 | 31 | 21 | ||||||||||||||
| 1035 | Certificate - 1 yr. | 93 | 82 | 105 | 92 | ||||||||||||||
| 1036 | Diploma | 24 | 20 | 19 | 22 | ||||||||||||||
| 1037 | Non-degree seeking | 29 | 26 | 44 | 13 | ||||||||||||||
| 1038 | Total | 1,460 | 1,265 | 1,752 | 1,500 | ||||||||||||||
| 1039 | |||||||||||||||||||
| 1040 | Northshore Site - Total | ||||||||||||||||||
| 1041 | Associate - 2 yr. | 2,428 | 1,920 | 1,553 | 1,352 | 0 | |||||||||||||
| 1042 | Post-Associate Cert | 65 | 59 | 31 | 21 | 0 | |||||||||||||
| 1043 | Certificate - 1 yr. | 199 | 153 | 105 | 92 | 0 | |||||||||||||
| 1044 | Diploma | 28 | 36 | 19 | 22 | 0 | |||||||||||||
| 1045 | Non-degree seeking | 21 | 45 | 44 | 13 | 0 | |||||||||||||
| 1046 | Total | 2,741 | 2,213 | 1,752 | 1,500 | 0 | |||||||||||||
| 1047 | |||||||||||||||||||
| 1048 | Technical Site - Jefferson | ||||||||||||||||||
| 1049 | Associate - 2 yr. | 127 | 123 | 222 | 274 | 276 | 149 | 117.3% | 2 | 0.7% | |||||||||
| 1050 | Post-Associate Cert | 3 | 6 | 11 | 10 | 9 | 6 | 200.0% | -1 | -10.0% | |||||||||
| 1051 | Certificate - 1 yr. | 134 | 208 | 286 | 305 | 263 | 129 | 96.3% | -42 | -13.8% | |||||||||
|---|---|---|---|---|---|---|---|---|---|---|---|---|---|---|---|---|---|---|---|
| 1052 | Diploma | 167 | 82 | 86 | 139 | 121 | -46 | -27.5% | -18 | -12.9% | |||||||||
| 1053 | Non-degree seeking | 15 | 33 | 48 | 141 | 117 | 102 | 680.0% | -24 | -17.0% | |||||||||
| 1054 | Total | 446 | 452 | 653 | 869 | 786 | 340 | 76.2% | -83 | -9.6% | |||||||||
| 1055 | |||||||||||||||||||
| 1056 | Technical Site - West Jefferson | ||||||||||||||||||
| 1057 | Associate - 2 yr. | 24 | 25 | ||||||||||||||||
| 1058 | Post-Associate Cert | 2 | 3 | ||||||||||||||||
| 1059 | Certificate - 1 yr. | 42 | 52 | ||||||||||||||||
| 1060 | Diploma | 121 | 154 | ||||||||||||||||
| 1061 | Non-degree seeking | 4 | 36 | ||||||||||||||||
| 1062 | Total | 193 | 270 | ||||||||||||||||
| 1063 | |||||||||||||||||||
| 1064 | Technical Site - Total | ||||||||||||||||||
| 1065 | Associate - 2 yr. | 151 | 148 | 222 | 274 | 276 | 125 | 82.8% | 2 | 0.7% | |||||||||
| 1066 | Post-Associate Cert | 5 | 9 | 11 | 10 | 9 | 4 | n/a | -1 | -10.0% | |||||||||
| 1067 | Certificate - 1 yr. | 176 | 260 | 286 | 305 | 263 | 87 | 49.4% | -42 | -13.8% | |||||||||
| 1068 | Diploma | 288 | 236 | 86 | 139 | 121 | -167 | -58.0% | -18 | -12.9% | |||||||||
| 1069 | Non-degree seeking | 19 | 69 | 48 | 141 | 117 | 98 | 515.8% | -24 | -17.0% | |||||||||
| 1070 | Total | 639 | 722 | 653 | 869 | 786 | 147 | 23.0% | -83 | -9.6% | |||||||||
| 1071 | |||||||||||||||||||
| 1072 | Sidney Collier Site | ||||||||||||||||||
| 1073 | Associate - 2 yr. | 55 | 295 | 235 | -60 | -20.3% | |||||||||||||
| 1074 | Post-Associate Cert | 0 | 0 | 1 | 1 | n/a | |||||||||||||
| 1075 | Certificate - 1 yr. | 37 | 97 | 95 | -2 | -2.1% | |||||||||||||
| 1076 | Diploma | 207 | 207 | 201 | -6 | -2.9% | |||||||||||||
| 1077 | Non-degree seeking | 0 | 1 | 3 | 2 | 200.0% | |||||||||||||
| 1078 | Total | 299 | 600 | 535 | -65 | -10.8% | |||||||||||||
| 1079 | |||||||||||||||||||
| 1080 | |||||||||||||||||||
| 1081 | 7/25/2017 | Office of Planning and Research | |||||||||||||||||
| 1082 | |||||||||||||||||||
| 1083 | Spring Enrollment History 2012-2016 by Division | ||||||||||||||||||
| 1084 | |||||||||||||||||||
| 1085 | |||||||||||||||||||
| 1086 | Number | % | Number | % | |||||||||||||||
| 1087 | Change | Change | Change | Change | |||||||||||||||
| 1088 | One College Divisions | Spring | Spring | Spring | Spring | Spring | 2013 | 2013 | 2016 | 2016 | |||||||||
| 1089 | 2013 | 2014 | 2015 | 2016 | 2017 | to 2017 | to 2017 | to 2017 | to 2017 | ||||||||||
| 1090 | |||||||||||||||||||
| 1091 | Allied Health | 3,859 | 3,382 | 3,341 | 2,935 | 2,608 | -1,251 | -32.4% | -327 | -11.1% | |||||||||
| 1092 | Arts and Humanities | 4,535 | 3,993 | 4,434 | 4,260 | 3,151 | -1,384 | -30.5% | -1,109 | -26.0% | |||||||||
| 1093 | Business and Technology | 4,364 | 4,090 | 4,049 | 3,636 | 3,221 | -1,143 | -26.2% | -415 | -11.4% | |||||||||
| 1094 | Communication | 458 | 288 | 233 | 215 | 59 | -399 | -87.1% | -156 | -72.6% | |||||||||
| 1095 | Charity School of Nursing | 650 | 715 | 711 | 701 | 590 | -60 | -9.2% | -111 | -15.8% | |||||||||
| 1096 | *Science and Mathematics | 3,073 | 2,954 | 2,604 | 2,504 | 2,819 | -254 | -8.3% | 315 | 12.6% | |||||||||
| 1097 | Technical Division | 744 | 742 | 787 | 777 | 663 | -81 | -10.9% | -114 | -14.7% | |||||||||
| 1098 | No College Designated | 533 | 761 | 857 | 947 | 1,220 | 687 | 128.9% | 273 | 28.8% | |||||||||
| 1099 | |||||||||||||||||||
| 1100 | College Total | 18,216 | 16,925 | 17,016 | 15,975 | 14,331 | -3,885 | -21.3% | -1,644 | -10.3% | |||||||||
| 1101 | * Including Pre-Nursing and Pre-Practical Nursing students. | ||||||||||||||||||
|---|---|---|---|---|---|---|---|---|---|---|---|---|---|---|---|---|---|---|---|
| 1102 | |||||||||||||||||||
| 1103 |
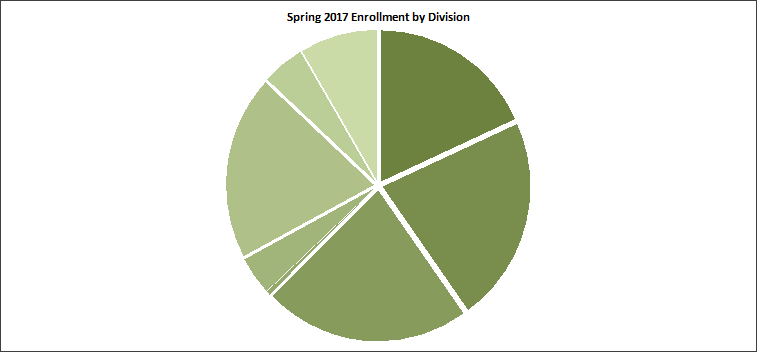
|
||||||||||||||||||
| 1104 | |||||||||||||||||||
| 1105 | |||||||||||||||||||
| 1106 | |||||||||||||||||||
| 1107 | |||||||||||||||||||
| 1108 | |||||||||||||||||||
| 1109 | |||||||||||||||||||
| 1110 | |||||||||||||||||||
| 1111 | |||||||||||||||||||
| 1112 | |||||||||||||||||||
| 1113 | |||||||||||||||||||
| 1114 | |||||||||||||||||||
| 1115 | |||||||||||||||||||
| 1116 | |||||||||||||||||||
| 1117 | |||||||||||||||||||
| 1118 | |||||||||||||||||||
| 1119 | |||||||||||||||||||
| 1120 | |||||||||||||||||||
| 1121 | |||||||||||||||||||
| 1122 | |||||||||||||||||||
| 1123 | |||||||||||||||||||
| 1124 | |||||||||||||||||||
| 1125 | |||||||||||||||||||
| 1126 | |||||||||||||||||||
| 1127 | |||||||||||||||||||
| 1128 | Spring Enrollment History 2012-2016 by Course Location/Class Campus | ||||||||||||||||||
| 1129 | |||||||||||||||||||
| 1130 | |||||||||||||||||||
| 1131 | Number | % | Number | % | |||||||||||||||
| 1132 | Course Location Enrollment | Change | Change | Change | Change | ||||||||||||||
| 1133 | Spring | Spring | Spring | Spring | Spring | 2013 | 2013 | 2016 | 2016 | ||||||||||
| 1134 | 2013 | 2014 | 2015 | 2016 | 2017 | to 2017 | to 2017 | to 2017 | to 2017 | ||||||||||
| 1135 | City Park Campus | 10,524 | 9,975 | 9,887 | 8,845 | 8,334 | -2,190 | -20.8% | -511 | -5.8% | |||||||||
| 1136 | West Bank Campus | 3,134 | 2,797 | 3,008 | 2,867 | 2,600 | -534 | -17.0% | -267 | -9.3% | |||||||||
| 1137 | Charity School of Nursing | 653 | 672 | 745 | 693 | 683 | 30 | 4.6% | -10 | -1.4% | |||||||||
| 1138 | Northshore Site | 2,716 | 1,841 | 1,561 | 1,365 | -2,716 | -100.0% | -1,365 | -100.0% | ||||||||||
| 1139 | Technical Site | 623 | 776 | 578 | 533 | 509 | -114 | -18.3% | -24 | -4.5% | |||||||||
| 1140 | Sidney Collier Site | 448 | 693 | 682 | -11 | -1.6% | |||||||||||||
| 1141 | Online | 4,284 | 4,402 | 4,671 | 5,177 | 5,171 | 887 | 20.7% | -6 | -0.1% | |||||||||
| 1142 | Offsite | 30 | 112 | 162 | 202 | 356 | 154 | 76.2% | |||||||||||
| 1143 | Total | 21,964 | 20,575 | 21,060 | 20,375 | 18,335 | -3,629 | -16.5% | -2,040 | -10.0% | |||||||||
| 1144 | Note: Student enrollment by course location is unduplicated on a per-school basis. | ||||||||||||||||||
| 1145 | The combined figures will be more than the college-wide headcount total because the student may enroll in courses at multiple locations. | ||||||||||||||||||
| 1146 | |||||||||||||||||||
| 1147 | Course Location SCH | ||||||||||||||||||
| 1148 | City Park Campus | 92,471 | 85,829 | 82,214 | 68,748 | 64,031 | -28,440 | -30.8% | -4,717 | -6.9% | |||||||||
| 1149 | West Bank Campus | 24,265 | 21,222 | 21,968 | 19,623 | 16,961 | -7,304 | -30.1% | -2,662 | -13.6% | |||||||||
| 1150 | Charity School of Nursing | 6,523 | 6,260 | 6,723 | 6,174 | 5,952 | -571 | -8.8% | -222 | -3.6% | |||||||||
| 1151 | Northshore Site | 21,254 | 13,453 | 11,184 | 9,705 | -21,254 | -100.0% | -9,705 | -100.0% | ||||||||||
|---|---|---|---|---|---|---|---|---|---|---|---|---|---|---|---|---|---|---|---|
| 1152 | Technical Site | 6,134 | 7,175 | 4,762 | 4,328 | 4,252 | -1,882 | -30.7% | -76 | -1.8% | |||||||||
| 1153 | Sidney Collier Site | 3,671 | 5,251 | 4,546 | -705 | -13.4% | |||||||||||||
| 1154 | Online | 23,852 | 25,141 | 26,343 | 28,235 | 28,725 | 4,873 | 20.4% | 490 | 1.7% | |||||||||
| 1155 | Offsite/Other | 136 | 484 | 495 | 604 | 1,377 | 1,241 | n/a | 773 | 128.0% | |||||||||
| 1156 | Total | 174,635 | 159,564 | 157,360 | 142,668 | 125,844 | -48,791 | -27.9% | -16,824 | -11.8% | |||||||||
| 1157 | |||||||||||||||||||
| 1158 | |||||||||||||||||||
| 1159 | |||||||||||||||||||
| 1160 | 7/25/2017 | Office of Planning and Research | |||||||||||||||||
| 1161 | |||||||||||||||||||
| 1162 | Spring Enrollment History 2013-2017 by Online Status | ||||||||||||||||||
| 1163 | |||||||||||||||||||
| 1164 | Number | % | Number | % | |||||||||||||||
| 1165 | College Wide | Change | Change | Change | Change | ||||||||||||||
| 1166 | Online Status | Spring | Spring | Spring | Spring | Spring | 2013 | 2013 | 2016 | 2016 | |||||||||
| 1167 | 2013 | 2014 | 2015 | 2016 | 2017 | to 2017 | to 2017 | to 2017 | to 2017 | ||||||||||
| 1168 | No. of students taking a web class | 4,284 | 4,402 | 4,671 | 5,223 | 5,171 | 887 | 20.7% | -52 | -1.0% | |||||||||
| 1169 | Students taking only web classes | 1,334 | 1,589 | 1,662 | 1,861 | 1,941 | 607 | 45.5% | 80 | 4.3% | |||||||||
| 1170 | Average no. of web courses taken | 1.87 | 1.92 | 1.90 | 1.83 | 1.88 | 0.01 | 0.4% | 0.05 | 2.6% | |||||||||
| 1171 | Students in only Face to Face classes | 13,932 | 12,523 | 12,345 | 10,752 | 9,160 | -4,772 | -34.3% | -1,592 | -14.8% | |||||||||
| 1172 | Total | 18,216 | 16,925 | 17,016 | 15,975 | 14,331 | -3,885 | -21.3% | -1,644 | -10.3% | |||||||||
| 1173 | |||||||||||||||||||
| 1174 | Percentages | ||||||||||||||||||
| 1175 | Students taking a web class | 23.5% | 26.0% | 27.5% | 32.7% | 36.1% | 6914 | ||||||||||||
| 1176 | Students taking only web classes | 7.3% | 9.4% | 9.8% | 11.6% | 13.5% | |||||||||||||
| 1177 | |||||||||||||||||||
| 1178 | City Park Campus | ||||||||||||||||||
| 1179 | No. of students taking a web class | 2,307 | 2,525 | 2,970 | 3,235 | 3,815 | 1,508 | 65.4% | 580 | 17.9% | |||||||||
| 1180 | Students taking only web classes | 774 | 928 | 1,053 | 1,205 | 1,517 | 743 | 96.0% | 312 | 25.9% | |||||||||
| 1181 | Average no. of web courses taken | 1.86 | 1.87 | 1.88 | 1.85 | 1.91 | 0.05 | 2.8% | 0.06 | 3.3% | |||||||||
| 1182 | Students in only Face to Face classes | 8,723 | 8,177 | 8,020 | 6,665 | 6,123 | -2,600 | -29.8% | -542 | -8.1% | |||||||||
| 1183 | Total | 11,030 | 10,702 | 10,990 | 9,900 | 9,938 | -1,092 | -9.9% | 38 | 0.4% | |||||||||
| 1184 | |||||||||||||||||||
| 1185 | West Bank Campus | ||||||||||||||||||
| 1186 | No. of students taking a web class | 780 | 761 | 788 | 834 | 913 | 133 | 17.1% | 79 | 9.5% | |||||||||
| 1187 | Students taking only web classes | 242 | 251 | 267 | 307 | 322 | 80 | 33.1% | 15 | 4.9% | |||||||||
| 1188 | Average no. of web courses taken | 1.90 | 1.89 | 1.86 | 1.83 | 1.95 | 0.05 | 2.7% | 0.12 | 6.3% | |||||||||
| 1189 | Students in only Face to Face classes | 2,174 | 1,812 | 1,822 | 1,571 | 1,462 | -712 | -32.8% | -109 | -6.9% | |||||||||
| 1190 | Total | 2,954 | 2,573 | 2,610 | 2,405 | 2,375 | -579 | -19.6% | -30 | -1.2% | |||||||||
| 1191 | |||||||||||||||||||
| 1192 | Charity School of Nursing | ||||||||||||||||||
| 1193 | No. of students taking a web class | 31 | 42 | 40 | 146 | 157 | 126 | 406.5% | 11 | 7.5% | |||||||||
| 1194 | Students taking only web classes | 8 | 15 | 11 | 13 | 16 | 8 | n/a | 3 | 23.1% | |||||||||
| 1195 | Average no. of web courses taken | 1.52 | 1.67 | 1.60 | 1.14 | 1.18 | -0.34 | -22.3% | 0.04 | 3.6% | |||||||||
| 1196 | Students in only Face to Face classes | 621 | 673 | 672 | 555 | 540 | -81 | -13.0% | -15 | -2.7% | |||||||||
| 1197 | Total | 652 | 715 | 712 | 701 | 697 | 45 | 6.9% | -4 | -0.6% | |||||||||
| 1198 | |||||||||||||||||||
| 1199 | Northshore Site - Covington | ||||||||||||||||||
| 1200 | No. of students taking a web class | 602 | 492 | ||||||||||||||||
| 1201 | Students taking only web classes | 165 | 197 | ||||||||||||||||
|---|---|---|---|---|---|---|---|---|---|---|---|---|---|---|---|---|---|---|---|
| 1202 | Average no. of web courses taken | 1.95 | 2.16 | ||||||||||||||||
| 1203 | Students in only Face to Face classes | 879 | 456 | ||||||||||||||||
| 1204 | Total | 1,481 | 948 | ||||||||||||||||
| 1205 | |||||||||||||||||||
| 1206 | Northshore Site - Slidell | ||||||||||||||||||
| 1207 | No. of students taking a web class | 504 | 488 | 733 | 725 | ||||||||||||||
| 1208 | Students taking only web classes | 124 | 164 | 287 | 263 | ||||||||||||||
| 1209 | Average no. of web courses taken | 1.83 | 2.04 | 2.04 | 1.97 | ||||||||||||||
| 1210 | Students in only Face to Face classes | 956 | 777 | 1,019 | 775 | ||||||||||||||
| 1211 | Total | 1,460 | 1,265 | 1,752 | 1,500 | ||||||||||||||
| 1212 | |||||||||||||||||||
| 1213 | Northshore Site - Total | ||||||||||||||||||
| 1214 | No of students taking a web class | 1,005 | 980 | 733 | 725 | ||||||||||||||
| 1215 | Students taking only web classes | 110 | 361 | 287 | 263 | ||||||||||||||
| 1216 | Average no. of web courses taken | 1.62 | 1.90 | 2.10 | 1.97 | ||||||||||||||
| 1217 | Students in only Face to Face classes | 1,736 | 1,233 | 1,019 | 775 | ||||||||||||||
| 1218 | Total | 2,741 | 2,213 | 1,752 | 1,500 | ||||||||||||||
| 1219 | |||||||||||||||||||
| 1220 | Technical Site - Jefferson | ||||||||||||||||||
| 1221 | No. of students taking a web class | 41 | 71 | 102 | 150 | 171 | 130 | 317.1% | 21 | 14.0% | |||||||||
| 1222 | Students taking only web classes | 17 | 25 | 31 | 44 | 52 | 35 | 205.9% | 8 | 18.2% | |||||||||
| 1223 | Average no. of web courses taken | 1.90 | 1.73 | 1.80 | 1.72 | 1.61 | -0.29 | -15.5% | -0.11 | -6.5% | |||||||||
| 1224 | Students in only Face to Face classes | 405 | 381 | 551 | 719 | 615 | 210 | 51.9% | -104 | -14.5% | |||||||||
| 1225 | Total | 446 | 452 | 653 | 869 | 786 | 340 | 76.2% | -83 | -9.6% | |||||||||
| 1226 | |||||||||||||||||||
| 1227 | Technical Site - West Jefferson | ||||||||||||||||||
| 1228 | No. of students taking a web class | 19 | 23 | ||||||||||||||||
| 1229 | Students taking only web classes | 4 | 9 | ||||||||||||||||
| 1230 | Average no. of web courses taken | 1.58 | 2.04 | ||||||||||||||||
| 1231 | Students in only Face to Face classes | 174 | 247 | ||||||||||||||||
| 1232 | Total | 193 | 270 | ||||||||||||||||
| 1233 | |||||||||||||||||||
| 1234 | Technical Site - Total | ||||||||||||||||||
| 1235 | No of students taking a web class | 20 | 94 | 102 | 150 | 171 | 151 | 755.0% | 21 | 14.0% | |||||||||
| 1236 | Students taking only web classes | 0 | 34 | 31 | 44 | 52 | 52 | n/a | 8 | 18.2% | |||||||||
| 1237 | Average no. of web courses taken | 1.10 | 1.80 | 1.81 | 1.72 | 1.61 | 0.51 | 46.2% | -0.11 | -6.5% | |||||||||
| 1238 | Students in only Face to Face classes | 929 | 579 | 579 | 719 | 615 | -314 | -33.8% | -104 | -14.5% | |||||||||
| 1239 | Total | 949 | 673 | 681 | 869 | 786 | -163 | -17.2% | -83 | -9.6% | |||||||||
| 1240 | |||||||||||||||||||
| 1241 | Sidney Collier Site | ||||||||||||||||||
| 1242 | No. of students taking a web class | 38 | 133 | 115 | -18 | -13.5% | |||||||||||||
| 1243 | Students taking only web classes | 13 | 29 | 34 | 5 | 17.2% | |||||||||||||
| 1244 | Average no. of web courses taken | 1.84 | 1.53 | 1.66 | 0.13 | 8.3% | |||||||||||||
| 1245 | Students in only Face to Face classes | 261 | 467 | 420 | -47 | -10.1% | |||||||||||||
| 1246 | Total | 299 | 600 | 535 | -65 | -10.8% | |||||||||||||
| 1247 | |||||||||||||||||||
| 1248 | |||||||||||||||||||
| 1249 | 7/25/2017 | Office of Planning and Research | |||||||||||||||||
| 1250 | |||||||||||||||||||
| 1251 | Spring Enrollment History 2013-2017 by Program | ||||||||||||||||||
|---|---|---|---|---|---|---|---|---|---|---|---|---|---|---|---|---|---|---|---|
| 1252 | Grouped by CIP Code | ||||||||||||||||||
| 1253 | |||||||||||||||||||
| 1254 | Number | % | Number | % | |||||||||||||||
| 1255 | College Wide | Change | Change | Change | Change | ||||||||||||||
| 1256 | Programs of Study | Spring | Spring | Spring | Spring | Spring | 2013 | 2013 | 2016 | 2016 | |||||||||
| 1257 | 2013 | 2014 | 2015 | 2016 | 2017 | to 2017 | to 2017 | to 2017 | to 2017 | CIP2 | |||||||||
| 1258 | English as a Second Language - DEG | 229 | 88 | 51 | 46 | 22 | -207 | -90.4% | -24 | -52.2% | |||||||||
| 1259 | English as a Second Language - NODEG | 169 | 123 | 120 | 114 | 111 | -58 | -34.3% | -3 | -2.6% | |||||||||
| 1260 | Non-degree Seeking, No Major | 523 | 547 | 458 | 411 | 237 | -286 | -54.7% | -174 | -42.3% | |||||||||
| 1261 | Non-degree: Dual Enrollment | 209 | 372 | 521 | 850 | n/a | n/a | 329 | 63.1% | ||||||||||
| 1262 | Uncommitted Students | 921 | 967 | 1,001 | 1,092 | 1,220 | 299 | 32.5% | 128 | 11.7% | 00 | ||||||||
| 1263 | Horticulture Technology | 54 | 51 | 41 | 35 | 27 | -27 | -50.0% | -8 | -22.9% | |||||||||
| 1264 | Agriculture & Operations | 54 | 51 | 41 | 35 | 27 | -27 | -50.0% | -8 | -22.9% | 01 | ||||||||
| 1265 | Environmental Studies/The Built Environment | 8 | 2 | n/a | n/a | n/a | n/a | ||||||||||||
| 1266 | Natural Resources & Conservation | 8 | 2 | 0 | n/a | n/a | n/a | n/a | 03 | ||||||||||
| 1267 | Performance & Media Arts | 288 | 103 | 32 | 12 | 5 | -283 | -98.3% | -7 | -58.3% | |||||||||
| 1268 | Communication, Journalism | 288 | 103 | 32 | 12 | 5 | -283 | -98.3% | -7 | -58.3% | 09 | ||||||||
| 1269 | Computer Information Technology | 363 | 334 | 375 | 349 | 322 | -41 | -11.3% | -27 | -7.7% | |||||||||
| 1270 | Computer Network Technology | 130 | 139 | 136 | 137 | 125 | -5 | -3.8% | -12 | -8.8% | |||||||||
| 1271 | Information Security/Assurance (TCA only) | 0 | 0 | 0 | 0 | n/a | n/a | 0 | n/a | ||||||||||
| 1272 | Web Site Design | 19 | 23 | 17 | 19 | 13 | -6 | -31.6% | -6 | -31.6% | |||||||||
| 1273 | Computer & Information Sciences | 512 | 496 | 528 | 505 | 460 | -52 | -10.2% | -45 | -8.9% | 11 | ||||||||
| 1274 | Barber-Styling | 31 | 43 | 31 | 31 | 47 | 16 | 51.6% | 16 | 51.6% | |||||||||
| 1275 | Cosmetology | 99 | 109 | 93 | 112 | 71 | -28 | -28.3% | -41 | -36.6% | |||||||||
| 1276 | Cosmetology Teacher Trainer | 6 | 0 | 0 | 0 | 0 | -6 | -100.0% | 0 | n/a | |||||||||
| 1277 | Culinary Arts | 286 | 251 | 256 | 218 | 199 | -87 | -30.4% | -19 | -8.7% | |||||||||
| 1278 | Culinary Arts - Catering | 3 | 0 | 0 | 0 | 0 | -3 | -100.0% | 0 | n/a | |||||||||
| 1279 | Culinary Arts: Line Cook | 0 | 1 | 3 | 2 | 2 | n/a | n/a | 0 | n/a | |||||||||
| 1280 | Culinary Cost Control/Supervision(TCA only) | 0 | 0 | 0 | 0 | n/a | n/a | n/a | n/a | ||||||||||
| 1281 | Culinary Management | 34 | 14 | 10 | 8 | 9 | -25 | -73.5% | 1 | 12.5% | |||||||||
| 1282 | Funeral Service Education | 121 | 133 | 141 | 118 | 107 | -14 | -11.6% | -11 | -9.3% | |||||||||
| 1283 | Pastry Arts | 49 | 41 | 21 | 25 | 20 | -29 | -59.2% | -5 | -20.0% | |||||||||
| 1284 | Personal & Culinary Services | 629 | 592 | 555 | 514 | 455 | -174 | -27.7% | -59 | -11.5% | 12 | ||||||||
| 1285 | Early Childhood Education | 0 | 0 | 0 | 0 | 0 | 0 | 0.0% | 0 | n/a | |||||||||
| 1286 | Teaching (Grades 1-5) | 274 | 264 | 256 | 231 | 206 | -68 | -24.8% | -25 | -10.8% | |||||||||
| 1287 | Education | 274 | 264 | 256 | 231 | 206 | -68 | -24.8% | -25 | -10.8% | 13 | ||||||||
| 1288 | Architectural/Design Construction Technology | 107 | 82 | 89 | 69 | 51 | -56 | -52.3% | -18 | -26.1% | |||||||||
| 1289 | Civil & Construction Applied Engineering Tech. | 113 | 94 | 114 | 61 | 47 | -66 | -58.4% | -14 | -23.0% | |||||||||
| 1290 | Computer Aided Design & Drafting | 178 | 164 | 173 | 110 | 59 | -119 | -66.9% | -51 | -46.4% | |||||||||
| 1291 | Electrical-Electronics Engineering Technology | 175 | 191 | 188 | 181 | 167 | -8 | -4.6% | -14 | -7.7% | |||||||||
| 1292 | Electronics Service Technology | 53 | 59 | 65 | 50 | 35 | -18 | -34.0% | -15 | -30.0% | |||||||||
| 1293 | NCCER Technical Core Studies (TCA only) | 1 | 0 | 0 | 0 | n/a | n/a | 0 | n/a | ||||||||||
| 1294 | Engineering Technologies | 626 | 591 | 629 | 471 | 359 | -267 | -42.7% | -112 | -23.8% | 15 | ||||||||
| 1295 | American Sign Language Interpreting | 62 | 69 | 62 | 54 | 59 | -3 | -4.8% | 5 | 9.3% | |||||||||
| 1296 | American Sign Language Studies | 2 | 0 | 0 | 0 | 0 | -2 | -100.0% | 0 | n/a | |||||||||
| 1297 | Foreign Languages, Literatures | 64 | 69 | 62 | 54 | 59 | -5 | -7.8% | 5 | 9.3% | 16 | ||||||||
| 1298 | Care & Development of Young Children | 429 | 385 | 380 | 341 | 289 | -140 | -32.6% | -52 | -15.2% | |||||||||
| 1299 | Family & Consumer/Human Sciences | 429 | 385 | 380 | 341 | 289 | -140 | -32.6% | -52 | -15.2% | 19 | ||||||||
| 1300 | Legal Secretary | 39 | 35 | 30 | 38 | 31 | -8 | -20.5% | -7 | -18.4% | |||||||||
| 1301 | Legal Professions & Studies | 39 | 35 | 30 | 38 | 31 | -8 | -20.5% | -7 | -18.4% | 22 | ||||||||
|---|---|---|---|---|---|---|---|---|---|---|---|---|---|---|---|---|---|---|---|
| 1302 | General Science | 14 | 4 | 0 | 0 | 0 | -14 | -100.0% | 0 | n/a | |||||||||
| 1303 | General Studies | 1,959 | 2,162 | 2,332 | 2,235 | 1,950 | -9 | -0.5% | -285 | -12.8% | |||||||||
| 1304 | Transfer Degree - A.A. | 208 | 208 | 251 | 306 | 223 | 15 | 7.2% | -83 | -27.1% | |||||||||
| 1305 | Transfer Degree - A.S. | 252 | 263 | 302 | 355 | 275 | 23 | 9.1% | -80 | -22.5% | |||||||||
| 1306 | Liberal Arts & Sciences, General Studies | 2,433 | 2,637 | 2,885 | 2,896 | 2,448 | 15 | 0.6% | -448 | -15.5% | 24 | ||||||||
| 1307 | Science Laboratory Technology | 10 | 40 | 46 | n/a | n/a | 6 | 15.0% | |||||||||||
| 1308 | Science Technologies/Technicians | 40 | 46 | n/a | n/a | 6 | 15.0% | 41 | |||||||||||
| 1309 | Criminal Justice | 745 | 556 | 578 | 509 | 432 | -313 | -42.0% | -77 | -15.1% | |||||||||
| 1310 | Fire Science Technology | 70 | 61 | 58 | 32 | 39 | -31 | -44.3% | 7 | 21.9% | |||||||||
| 1311 | Homeland Security, Law Enforcement, Firefighting | 815 | 617 | 636 | 541 | 471 | -344 | -42.2% | -70 | -12.9% | 43 | ||||||||
| 1312 | Carpentry | 22 | 25 | 25 | 40 | 25 | 3 | 13.6% | -15 | -37.5% | |||||||||
| 1313 | Electric Line Technician | 8 | 1 | 2 | 1 | 2 | -6 | -75.0% | 1 | n/a | |||||||||
| 1314 | Electrical Technology | 28 | 10 | 3 | 0 | 0 | -28 | -100.0% | 0 | 0.0% | |||||||||
| 1315 | Electrician: Commercial | 0 | 14 | 27 | 39 | 30 | n/a | n/a | -9 | -23.1% | |||||||||
| 1316 | Electrician: Residential | 46 | 65 | 72 | 80 | 68 | n/a | n/a | -12 | -15.0% | |||||||||
| 1317 | Electrician: Small Industrial | 0 | 5 | 15 | 15 | 11 | n/a | n/a | -4 | -26.7% | |||||||||
| 1318 | Marine/Maintenance Electrical Apprentice | 3 | 2 | 7 | 3 | 4 | n/a | n/a | 1 | 33.3% | |||||||||
| 1319 | Painter Apprentice | 0 | 4 | 7 | 5 | 5 | 5 | n/a | 0 | 0.0% | |||||||||
| 1320 | Pipefitter Apprentice | 1 | 2 | 2 | 2 | 2 | 1 | 100.0% | 0 | 0.0% | |||||||||
| 1321 | Construction Trades | 108 | 128 | 160 | 185 | 147 | 39 | 36.1% | -38 | -20.5% | 46 | ||||||||
| 1322 | |||||||||||||||||||
| 1323 | |||||||||||||||||||
| 1324 | 7/25/2017 | Office of Planning and Research | |||||||||||||||||
| 1325 | |||||||||||||||||||
| 1326 | Spring Enrollment History 2013-2017 by Program | ||||||||||||||||||
| 1327 | Grouped by CIP Code (cont.) | ||||||||||||||||||
| 1328 | |||||||||||||||||||
| 1329 | Number | % | Number | % | |||||||||||||||
| 1330 | College Wide | Change | Change | Change | Change | ||||||||||||||
| 1331 | Programs of Study | Spring | Spring | Spring | Spring | Spring | 2013 | 2013 | 2016 | 2016 | |||||||||
| 1332 | 2013 | 2014 | 2015 | 2016 | 2017 | to 2017 | to 2017 | to 2017 | to 2017 | CIP2 | |||||||||
| 1333 | (Air-Conditioning) Certified HVAC Technician | 30 | 45 | 52 | 55 | 57 | 27 | 90.0% | 2 | 3.6% | |||||||||
| 1334 | (Air-Conditioning) Master HVAC/R Technician | 72 | 57 | 82 | 60 | 62 | -10 | -13.9% | 2 | 3.3% | |||||||||
| 1335 | Automotive Technician | 0 | 0 | 0 | 0 | 0 | 0 | 0.0% | 0 | n/a | |||||||||
| 1336 | Computer & Electronics Service Technology | 47 | 37 | 42 | 32 | 31 | -16 | -34.0% | -1 | -3.1% | |||||||||
| 1337 | Diesel Power Technology | 2 | 1 | n/a | n/a | n/a | n/a | ||||||||||||
| 1338 | Industrial Maintenance Technology | 4 | 10 | 5 | n/a | n/a | n/a | n/a | |||||||||||
| 1339 | Motor Vehicle Technology | 263 | 229 | 223 | 194 | 160 | -103 | -39.2% | -34 | -17.5% | |||||||||
| 1340 | Motor Vehicle Maintenance & Light Repair | 1 | 0 | 0 | 0 | 0 | -1 | -100.0% | 0 | n/a | |||||||||
| 1341 | Mechanic & Repair Technologies | 415 | 369 | 403 | 351 | 315 | -100 | -24.1% | -36 | -10.3% | 47 | ||||||||
| 1342 | Machine Tool Technology | 39 | 25 | 7 | 0 | 0 | -39 | -100.0% | 0 | 0.0% | |||||||||
| 1343 | Inside Machinist Apprentice | 6 | 5 | 14 | 3 | 0 | n/a | n/a | -3 | -100.0% | |||||||||
| 1344 | Precision Machining | 12 | 28 | 14 | n/a | n/a | -14 | -50.0% | |||||||||||
| 1345 | Pipewelder Apprentice | 1 | 1 | 0 | 0 | 0 | -1 | n/a | 0 | n/a | |||||||||
| 1346 | Sheetmetal Apprentice | 0 | 0 | 2 | 4 | 0 | 0 | n/a | -4 | n/a | |||||||||
| 1347 | Welding | 86 | 99 | 107 | 102 | 107 | 21 | 24.4% | 5 | 4.9% | |||||||||
| 1348 | Precision Production | 132 | 130 | 142 | 137 | 121 | -11 | -8.3% | -16 | -11.7% | 48 | ||||||||
| 1349 | Audio Engineering (TCA only) | 0 | 0 | 0 | 0 | 0 | 0 | 0.0% | 0 | n/a | |||||||||
| 1350 | Fine Arts | 19 | 5 | 4 | 1 | 1 | -18 | -94.7% | 0 | 0.0% | |||||||||
| 1351 | Graphics & Editing Assistant | 7 | 1 | 0 | 0 | 0 | -7 | -100.0% | 0 | n/a | |||||||||
|---|---|---|---|---|---|---|---|---|---|---|---|---|---|---|---|---|---|---|---|
| 1352 | Interior Design | 101 | 88 | 88 | 75 | 74 | -27 | -26.7% | -1 | -1.3% | |||||||||
| 1353 | Kitchen & Bath Design | 1 | 4 | 5 | 9 | n/a | n/a | 4 | 80.0% | ||||||||||
| 1354 | Music | 24 | 8 | 2 | 0 | 0 | -24 | -100.0% | 0 | 0.0% | |||||||||
| 1355 | Music Business (TCA only) | 0 | 0 | 0 | 0 | 0 | 0 | n/a | 0 | n/a | |||||||||
| 1356 | Visual Communications-Graphic Design | 217 | 212 | 205 | 190 | 186 | -31 | -14.3% | -4 | -2.1% | |||||||||
| 1357 | Visual & Performing Arts | 368 | 315 | 303 | 271 | 270 | -98 | -26.6% | -1 | -0.4% | 50 | ||||||||
| 1358 | Diagnostic Medical Sonography | 221 | 197 | 150 | 129 | 115 | -106 | -48.0% | -14 | -10.9% | |||||||||
| 1359 | Dietetics Technician | 74 | 66 | 72 | 62 | 59 | -15 | -20.3% | -3 | -4.8% | |||||||||
| 1360 | Emergency Medical Technician-Paramedic | 153 | 133 | 119 | 118 | 107 | -46 | -30.1% | -11 | -9.3% | |||||||||
| 1361 | Health Information Technology | 154 | 166 | 162 | 126 | 108 | -46 | -29.9% | -18 | -14.3% | |||||||||
| 1362 | Massage Therapy | 50 | 50 | 57 | 59 | 52 | 2 | 4.0% | -7 | -11.9% | |||||||||
| 1363 | Medical Coding | 213 | 159 | 189 | 169 | 166 | -47 | -22.1% | -3 | -1.8% | |||||||||
| 1364 | Medical Laboratory Technician | 164 | 147 | 149 | 133 | 123 | -41 | -25.0% | -10 | -7.5% | |||||||||
| 1365 | Medical Registration Specialist | 38 | 96 | 89 | 63 | n/a | n/a | -26 | -29.2% | ||||||||||
| 1366 | Nuclear Medicine Technology | 31 | 38 | 21 | 22 | 23 | -8 | -25.8% | 1 | 4.5% | |||||||||
| 1367 | Nursing - Practical Nursing | 455 | 382 | 448 | 435 | 361 | -94 | -20.7% | -74 | -17.0% | |||||||||
| 1368 | Nursing - Registered Nursing | 3,271 | 3,020 | 2,867 | 2,674 | 2,504 | -767 | -23.4% | -170 | -6.4% | |||||||||
| 1369 | Occupational Therapy Assistant | 186 | 153 | 168 | 150 | 125 | -61 | -32.8% | -25 | -16.7% | |||||||||
| 1370 | Ophthalmic Medical Assistant | 26 | 20 | 22 | 22 | 18 | -8 | -30.8% | -4 | -18.2% | |||||||||
| 1371 | Patient Care Tech | 1 | 0 | 0 | 0 | 0 | -1 | -100.0% | 0 | n/a | |||||||||
| 1372 | Pharmacy Technician | 302 | 284 | 254 | 224 | 159 | -143 | -47.4% | -65 | -29.0% | |||||||||
| 1373 | Physical Therapist Assistant | 585 | 440 | 413 | 366 | 321 | -264 | -45.1% | -45 | -12.3% | |||||||||
| 1374 | Polysomnographic Technology | 18 | 19 | 26 | 27 | n/a | n/a | 1 | 3.8% | ||||||||||
| 1375 | Radiation Therapy | 87 | 79 | 71 | 56 | 52 | -35 | -40.2% | -4 | -7.1% | |||||||||
| 1376 | Radiologic Technology | 831 | 730 | 714 | 607 | 503 | -328 | -39.5% | -104 | -17.1% | |||||||||
| 1377 | Respiratory Care Technology | 189 | 145 | 154 | 134 | 107 | -82 | -43.4% | -27 | -20.1% | |||||||||
| 1378 | Surgical Technology | 255 | 209 | 197 | 218 | 203 | -52 | -20.4% | -15 | -6.9% | |||||||||
| 1379 | Veterinary Technology | 216 | 188 | 189 | 172 | 170 | -46 | -21.3% | -2 | -1.2% | |||||||||
| 1380 | Health Professions & Programs | 7,464 | 6,662 | 6,531 | 5,991 | 5,366 | -2,098 | -28.1% | -625 | -10.4% | 51 | ||||||||
| 1381 | Accounting | 464 | 332 | 299 | 275 | 253 | -211 | -45.5% | -22 | -8.0% | |||||||||
| 1382 | Accounting Technology: Account Clerk | 31 | 105 | 98 | 88 | 71 | 40 | 129.0% | -17 | -19.3% | |||||||||
| 1383 | Administrative Office Technology | 99 | 29 | 10 | 3 | 1 | -98 | -99.0% | -2 | -66.7% | |||||||||
| 1384 | Business & Management | 1,143 | 1,046 | 1,118 | 1,025 | 923 | -220 | -19.2% | -102 | -10.0% | |||||||||
| 1385 | Business Administration | 718 | 800 | 731 | 707 | 633 | -85 | -11.8% | -74 | -10.5% | |||||||||
| 1386 | Construction Management Technology | 13 | 4 | 0 | 0 | 0 | -13 | -100.0% | 0 | n/a | |||||||||
| 1387 | Entrepreneurship | 27 | 38 | 29 | 38 | 47 | 20 | 74.1% | 9 | 23.7% | |||||||||
| 1388 | Hospitality Management | 128 | 145 | 142 | 129 | 111 | -17 | -13.3% | -18 | -14.0% | |||||||||
| 1389 | Logistics Technology | 6 | 6 | 5 | 5 | 5 | -1 | -16.7% | 0 | 0.0% | |||||||||
| 1390 | Office Systems Technology | 8 | 7 | 0 | 0 | 0 | -8 | -100.0% | 0 | n/a | |||||||||
| 1391 | Business, Management, Marketing | 2,637 | 2,512 | 2,432 | 2,270 | 2,044 | -593 | -22.5% | -226 | -10.0% | 52 | ||||||||
| 1392 | |||||||||||||||||||
| 1393 | Total | 18,216 | 16,925 | 17,006 | 15,975 | 14,339 | -3,877 | -21.3% | -1,636 | -10.2% | |||||||||
| 1394 | |||||||||||||||||||
| 1395 | |||||||||||||||||||
| 1396 | 7/25/2017 | Office of Planning and Research | |||||||||||||||||
| 1397 | |||||||||||||||||||
| 1398 | Spring Enrollment 2017 by Major | ||||||||||||||||||
| 1399 | Ranked by Student Total | ||||||||||||||||||
| 1400 | |||||||||||||||||||
| 1401 | |||||||||||||||||||
|---|---|---|---|---|---|---|---|---|---|---|---|---|---|---|---|---|---|---|---|
| 1402 | |||||||||||||||||||
| 1403 | College Wide | ||||||||||||||||||
| 1404 | Major | Spring | |||||||||||||||||
| 1405 | 2017 | 2017 Rank | 2016 Rank | ||||||||||||||||
| 1406 | Nursing - Registered Nursing | 2,504 | 1 | 1 | |||||||||||||||
| 1407 | General Studies | 1,950 | 2 | 2 | |||||||||||||||
| 1408 | Business & Management | 923 | 3 | 3 | |||||||||||||||
| 1409 | Non-degree: Dual Enrollment | 850 | 4 | 6 | |||||||||||||||
| 1410 | Business Administration | 633 | 5 | 4 | |||||||||||||||
| 1411 | Radiologic Technology | 503 | 6 | 5 | |||||||||||||||
| 1412 | Criminal Justice | 432 | 7 | 7 | |||||||||||||||
| 1413 | Nursing - Practical Nursing | 361 | 8 | 8 | |||||||||||||||
| 1414 | Computer Information Technology | 322 | 9 | 12 | |||||||||||||||
| 1415 | Physical Therapist Assistant | 321 | 10 | 10 | |||||||||||||||
| 1416 | Care & Development of Young Children | 289 | 11 | 13 | |||||||||||||||
| 1417 | Transfer Degree - A.S. | 275 | 12 | 11 | |||||||||||||||
| 1418 | Accounting | 253 | 13 | 15 | |||||||||||||||
| 1419 | Non-degree Seeking, No Major | 237 | 14 | 9 | |||||||||||||||
| 1420 | Transfer Degree - A.A. | 223 | 15 | 14 | |||||||||||||||
| 1421 | Teaching (Grades 1-5) | 206 | 16 | 16 | |||||||||||||||
| 1422 | Surgical Technology | 203 | 17 | 18 | |||||||||||||||
| 1423 | Culinary Arts | 199 | 18 | 18 | |||||||||||||||
| 1424 | Visual Communications-Graphic Design | 186 | 19 | 21 | |||||||||||||||
| 1425 | Veterinary Technology | 170 | 20 | 23 | |||||||||||||||
| 1426 | Electrical-Electronics Engineering Technology | 167 | 21 | 22 | |||||||||||||||
| 1427 | Medical Coding | 166 | 22 | 24 | |||||||||||||||
| 1428 | Motor Vehicle Technology | 160 | 23 | 20 | |||||||||||||||
| 1429 | Pharmacy Technician | 159 | 24 | 17 | |||||||||||||||
| 1430 | Occupational Therapy Assistant | 125 | 25 | 25 | |||||||||||||||
| 1431 | Computer Network Technology | 125 | 25 | 26 | |||||||||||||||
| 1432 | Medical Laboratory Technician | 123 | 27 | 28 | |||||||||||||||
| 1433 | Diagnostic Medical Sonography | 115 | 28 | 29 | |||||||||||||||
| 1434 | Hospitality Management | 111 | 29 | 29 | |||||||||||||||
| 1435 | English as a Second Language - NODEG | 111 | 29 | 34 | |||||||||||||||
| 1436 | Health Information Technology | 108 | 31 | 31 | |||||||||||||||
| 1437 | Respiratory Care Technology | 107 | 32 | 27 | |||||||||||||||
| 1438 | Funeral Service Education | 107 | 32 | 32 | |||||||||||||||
| 1439 | Emergency Medical Technician-Paramedic | 107 | 32 | 32 | |||||||||||||||
| 1440 | Welding | 107 | 32 | 37 | |||||||||||||||
| 1441 | Interior Design | 74 | 36 | 41 | |||||||||||||||
| 1442 | Cosmetology | 71 | 37 | 35 | |||||||||||||||
| 1443 | Accounting Technology: Account Clerk | 71 | 37 | 39 | |||||||||||||||
| 1444 | Electrician: Residential | 68 | 39 | 40 | |||||||||||||||
| 1445 | Medical Registration Specialist | 63 | 40 | 38 | |||||||||||||||
| 1446 | (Air-Conditioning) Master HVAC/R Technician | 62 | 41 | 45 | |||||||||||||||
| 1447 | Computer Aided Design & Drafting | 59 | 42 | 36 | |||||||||||||||
| 1448 | Dietetics Technician | 59 | 42 | 43 | |||||||||||||||
| 1449 | American Sign Language Interpreting | 59 | 42 | 49 | |||||||||||||||
| 1450 | (Air-Conditioning) Certified HVAC Technician | 57 | 45 | 48 | |||||||||||||||
| 1451 | Massage Therapy | 52 | 46 | 46 | |||||||||||||||
|---|---|---|---|---|---|---|---|---|---|---|---|---|---|---|---|---|---|---|---|
| 1452 | Radiation Therapy | 52 | 46 | 47 | |||||||||||||||
| 1453 | Architectural/Design Construction Technology | 51 | 48 | 42 | |||||||||||||||
| 1454 | Civil & Construction Applied Engineering Tech. | 47 | 49 | 44 | |||||||||||||||
| 1455 | Entrepreneurship | 47 | 49 | 55 | |||||||||||||||
| 1456 | Barber-Styling | 47 | 49 | 60 | |||||||||||||||
| 1457 | Science Laboratory Technology | 46 | 52 | 52 | |||||||||||||||
| 1458 | Fire Science Technology | 39 | 53 | 58 | |||||||||||||||
| 1459 | Electronics Service Technology | 35 | 54 | 50 | |||||||||||||||
| 1460 | Legal Secretary | 31 | 55 | 55 | |||||||||||||||
| 1461 | Computer & Electronics Service Technology | 31 | 55 | 58 | |||||||||||||||
| 1462 | Electrician: Commercial | 30 | 57 | 54 | |||||||||||||||
| 1463 | Horticulture Technology | 27 | 58 | 57 | |||||||||||||||
| 1464 | Polysomnographic Technology | 27 | 58 | 62 | |||||||||||||||
| 1465 | Carpentry | 25 | 60 | 52 | |||||||||||||||
| 1466 | |||||||||||||||||||
| 1467 | |||||||||||||||||||
| 1468 | |||||||||||||||||||
| 1469 | 7/25/2017 | Office of Planning and Research | |||||||||||||||||
| 1470 | |||||||||||||||||||
| 1471 | Spring Enrollment 2016 by Major Ranked by Student Total (cont.) | ||||||||||||||||||
| 1472 | |||||||||||||||||||
| 1473 | |||||||||||||||||||
| 1474 | College Wide | ||||||||||||||||||
| 1475 | Major | Spring | |||||||||||||||||
| 1476 | 2017 | 2017 Rank | 2016 Rank | ||||||||||||||||
| 1477 | Nuclear Medicine Technology | 23 | 61 | 64 | |||||||||||||||
| 1478 | English as a Second Language - DEG | 22 | 62 | 51 | |||||||||||||||
| 1479 | Pastry Arts | 20 | 63 | 63 | |||||||||||||||
| 1480 | Ophthalmic Medical Assistant | 18 | 64 | 64 | |||||||||||||||
| 1481 | Precision Machining | 14 | 65 | 61 | |||||||||||||||
| 1482 | Web Site Design | 13 | 66 | 66 | |||||||||||||||
| 1483 | Electrician: Small Industrial | 11 | 67 | 67 | |||||||||||||||
| 1484 | Culinary Management | 9 | 68 | 70 | |||||||||||||||
| 1485 | Kitchen & Bath Design | 9 | 68 | 71 | |||||||||||||||
| 1486 | Performance & Media Arts | 5 | 70 | 68 | |||||||||||||||
| 1487 | Industrial Maintenance Technology | 5 | 70 | 69 | |||||||||||||||
| 1488 | Painter Apprentice | 5 | 70 | 71 | |||||||||||||||
| 1489 | Logistics Technology | 5 | 70 | 71 | |||||||||||||||
| 1490 | Marine/Maintenance Electrical Apprentice | 4 | 74 | 75 | |||||||||||||||
| 1491 | Culinary Arts: Line Cook | 2 | 75 | 78 | |||||||||||||||
| 1492 | Pipefitter Apprentice | 2 | 75 | 78 | |||||||||||||||
| 1493 | Electric Line Technician | 2 | 75 | 80 | |||||||||||||||
| 1494 | Administrative Office Technology | 1 | 78 | 75 | |||||||||||||||
| 1495 | Fine Arts | 1 | 78 | 80 | |||||||||||||||
| 1496 | Others | 5,861 | |||||||||||||||||
| 1497 | Total | 14,339 | |||||||||||||||||
| 1498 |
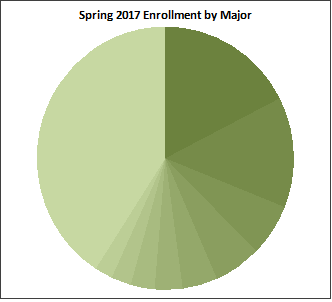
|
||||||||||||||||||
| 1499 | |||||||||||||||||||
| 1500 | |||||||||||||||||||
| 1501 | |||||||||||||||||||
| 1502 | |||||||||||||||||||
| 1503 | |||||||||||||||||||
| 1504 | |||||||||||||||||||
| 1505 | |||||||||||||||||||
| 1506 | |||||||||||||||||||
| 1507 | |||||||||||||||||||
| 1508 | |||||||||||||||||||
| 1509 | |||||||||||||||||||
| 1510 | |||||||||||||||||||
| 1511 | |||||||||||||||||||
| 1512 | |||||||||||||||||||
| 1513 | |||||||||||||||||||
| 1514 | |||||||||||||||||||
| 1515 | |||||||||||||||||||
| 1516 | |||||||||||||||||||
| 1517 | |||||||||||||||||||
| 1518 | |||||||||||||||||||
| 1519 | Spring Enrollment History 2013-2017 by Parish | ||||||||||||||||||
| 1520 | |||||||||||||||||||
| 1521 | |||||||||||||||||||
| 1522 | Number | % | Number | % | |||||||||||||||
| 1523 | College Wide | Change | Change | Change | Change | ||||||||||||||
| 1524 | Parish | Spring | Spring | Spring | Spring | Spring | 2013 | 2013 | 2016 | 2016 | |||||||||
| 1525 | 2013 | 2014 | 2015 | 2016 | 2017 | to 2017 | to 2017 | to 2017 | to 2017 | ||||||||||
| 1526 | Orleans | 5,739 | 5,677 | 6,027 | 5,521 | 5,129 | -610 | -10.6% | -392 | -7.1% | |||||||||
| 1527 | Jefferson | 6,016 | 5,651 | 5,750 | 5,552 | 5,117 | -899 | -14.9% | -435 | -7.8% | |||||||||
| 1528 | St. Tammany | 2,569 | 2,245 | 2,082 | 1,974 | 1,450 | -1,119 | -43.6% | -524 | -26.5% | |||||||||
| 1529 | St. Charles | 577 | 500 | 507 | 474 | 461 | -116 | -20.1% | -13 | -2.7% | |||||||||
| 1530 | Plaquemines | 263 | 240 | 270 | 238 | 297 | 34 | 12.9% | 59 | 24.8% | |||||||||
| 1531 | St. John | 333 | 309 | 336 | 360 | 289 | -44 | -13.2% | -71 | -19.7% | |||||||||
| 1532 | St. Bernard | 280 | 249 | 251 | 240 | 204 | -76 | -27.1% | -36 | -15.0% | |||||||||
| 1533 | Tangipahoa | 447 | 329 | 237 | 179 | 150 | -297 | -66.4% | -29 | -16.2% | |||||||||
| 1534 | East Baton Rouge | 163 | 150 | 124 | 113 | 105 | -58 | -35.6% | -8 | -7.1% | |||||||||
| 1535 | Terrebonne | 108 | 105 | 100 | 86 | 90 | -18 | -16.7% | 4 | 4.7% | |||||||||
| 1536 | Lafourche | 103 | 81 | 73 | 72 | 76 | -27 | -26.2% | 4 | 5.6% | |||||||||
| 1537 | Washington | 264 | 158 | 124 | 86 | 59 | -205 | -77.7% | -27 | -31.4% | |||||||||
| 1538 | Livingston | 65 | 56 | 60 | 62 | 38 | -27 | -41.5% | -24 | -38.7% | |||||||||
| 1539 | St. James | 52 | 51 | 47 | 34 | 30 | -22 | -42.3% | -4 | -11.8% | |||||||||
| 1540 | Other | 1,237 | 1,124 | 1,028 | 984 | 836 | -401 | -32.4% | -148 | -15.0% | |||||||||
| 1541 | Total | 18,216 | 16,925 | 17,016 | 15,975 | 14,331 | -3,885 | -21.3% | -1,644 | -10.3% | |||||||||
| 1542 | |||||||||||||||||||
| 1543 | |||||||||||||||||||
| 1544 | |||||||||||||||||||
| 1545 | |||||||||||||||||||
| 1546 | 7/25/2017 | Office of Planning and Research | |||||||||||||||||
| 1547 | |||||||||||||||||||
| 1548 | Spring Enrollment History 2013-2017 by Parish | ||||||||||||||||||
| 1549 | |||||||||||||||||||
| 1550 | |||||||||||||||||||
| 1551 | |||||||||||||||||||
|---|---|---|---|---|---|---|---|---|---|---|---|---|---|---|---|---|---|---|---|
| 1552 |
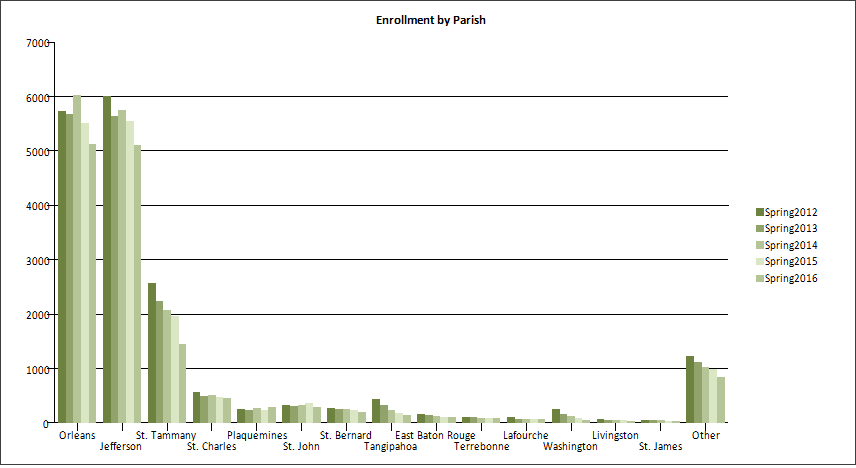
|
||||||||||||||||||
| 1553 | |||||||||||||||||||
| 1554 |
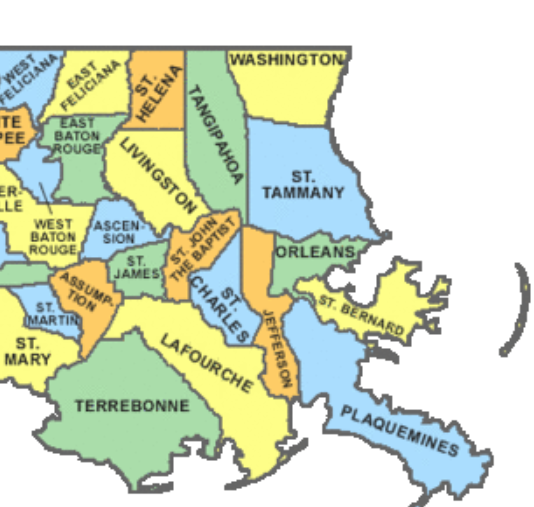
|
||||||||||||||||||
| 1555 | |||||||||||||||||||
| 1556 | |||||||||||||||||||
| 1557 | |||||||||||||||||||
| 1558 | |||||||||||||||||||
| 1559 | |||||||||||||||||||
| 1560 | |||||||||||||||||||
| 1561 | |||||||||||||||||||
| 1562 | |||||||||||||||||||
| 1563 | |||||||||||||||||||
| 1564 | |||||||||||||||||||
| 1565 | |||||||||||||||||||
| 1566 | |||||||||||||||||||
| 1567 | |||||||||||||||||||
| 1568 | |||||||||||||||||||
| 1569 | |||||||||||||||||||
| 1570 | |||||||||||||||||||
| 1571 | |||||||||||||||||||
| 1572 | |||||||||||||||||||
| 1573 | |||||||||||||||||||
| 1574 | |||||||||||||||||||
| 1575 | |||||||||||||||||||
| 1576 | |||||||||||||||||||
| 1577 | |||||||||||||||||||
| 1578 | |||||||||||||||||||
| 1579 | |||||||||||||||||||
| 1580 | |||||||||||||||||||
| 1581 | |||||||||||||||||||
| 1582 | |||||||||||||||||||
| 1583 | Number | % | Number | % | |||||||||||||||
| 1584 | Change | Change | Change | Change | |||||||||||||||
| 1585 | City Park Campus | Spring | Spring | Spring | Spring | Spring | 2013 | 2013 | 2016 | 2016 | |||||||||
| 1586 | Parish | 2013 | 2014 | 2015 | 2016 | 2017 | to 2017 | to 2017 | to 2017 | to 2017 | |||||||||
| 1587 | Orleans | 4,404 | 4,378 | 4,579 | 4,002 | 3,788 | -616 | -14.0% | -214 | -5.3% | |||||||||
| 1588 | Jefferson | 3,672 | 3,516 | 3,551 | 3,276 | 3,023 | -649 | -17.7% | -253 | -7.7% | |||||||||
| 1589 | St. Tammany | 541 | 604 | 635 | 573 | 1,176 | 635 | 117.4% | 603 | 105.2% | |||||||||
| 1590 | St. Charles | 496 | 408 | 405 | 372 | 358 | -138 | -27.8% | -14 | -3.8% | |||||||||
| 1591 | St. John | 289 | 263 | 288 | 302 | 242 | -47 | -16.3% | -60 | -19.9% | |||||||||
| 1592 | St. Bernard | 197 | 183 | 187 | 177 | 147 | -50 | -25.4% | -30 | -16.9% | |||||||||
| 1593 | Tangipahoa | 85 | 91 | 116 | 83 | 127 | 42 | 49.4% | 44 | 53.0% | |||||||||
| 1594 | Plaquemines | 65 | 61 | 102 | 84 | 96 | 31 | 47.7% | 12 | 14.3% | |||||||||
| 1595 | East Baton Rouge | 130 | 122 | 100 | 93 | 90 | -40 | -30.8% | -3 | -3.2% | |||||||||
| 1596 | Terrebonne | 87 | 80 | 76 | 58 | 67 | -20 | -23.0% | 9 | 15.5% | |||||||||
| 1597 | Lafourche | 80 | 66 | 59 | 57 | 60 | -20 | -25.0% | 3 | 5.3% | |||||||||
| 1598 | Washington | 34 | 34 | 41 | 27 | 51 | 17 | 50.0% | 24 | 88.9% | |||||||||
| 1599 | Ascension | 35 | 28 | 33 | 37 | 42 | 7 | 20.0% | 5 | 13.5% | |||||||||
| 1600 | Livingston | 23 | 18 | 31 | 44 | 28 | 5 | 21.7% | -16 | -36.4% | |||||||||
| 1601 | St. James | 45 | 46 | 41 | 26 | 23 | -22 | -48.9% | -3 | -11.5% | |||||||||
|---|---|---|---|---|---|---|---|---|---|---|---|---|---|---|---|---|---|---|---|
| 1602 | Other | 847 | 804 | 746 | 689 | 620 | -227 | -26.8% | -69 | -10.0% | |||||||||
| 1603 | Total | 11,030 | 10,702 | 10,990 | 9,900 | 9,938 | -1,092 | -9.9% | 38 | 0.4% | |||||||||
| 1604 | |||||||||||||||||||
| 1605 | |||||||||||||||||||
| 1606 | |||||||||||||||||||
| 1607 | West Bank Campus | ||||||||||||||||||
| 1608 | Jefferson | 1,707 | 1,452 | 1,490 | 1,372 | 1,372 | -335 | -19.6% | 0 | 0.0% | |||||||||
| 1609 | Orleans | 824 | 759 | 793 | 720 | 720 | -104 | -12.6% | 0 | 0.0% | |||||||||
| 1610 | Plaquemines | 175 | 157 | 145 | 125 | 125 | -50 | -28.6% | 0 | 0.0% | |||||||||
| 1611 | St. Charles | 33 | 41 | 41 | 29 | 29 | -4 | -12.1% | 0 | 0.0% | |||||||||
| 1612 | St. Tammany | 29 | 16 | 15 | 13 | 13 | -16 | -55.2% | 0 | 0.0% | |||||||||
| 1613 | East Baton Rouge | 11 | 11 | 12 | 7 | 7 | -4 | -36.4% | 0 | 0.0% | |||||||||
| 1614 | St. Bernard | 13 | 16 | 10 | 10 | 10 | -3 | -23.1% | 0 | 0.0% | |||||||||
| 1615 | St. John | 10 | 5 | 9 | 13 | 13 | 3 | 30.0% | 0 | 0.0% | |||||||||
| 1616 | Terrebonne | 6 | 8 | 6 | 9 | 9 | 3 | 50.0% | 0 | 0.0% | |||||||||
| 1617 | Lafourche | 11 | 5 | 5 | 3 | 3 | -8 | -72.7% | 0 | 0.0% | |||||||||
| 1618 | St. James | 3 | 2 | 2 | 3 | 3 | 0 | n/a | 0 | 0.0% | |||||||||
| 1619 | Other | 132 | 101 | 82 | 101 | 101 | -31 | -23.5% | 0 | 0.0% | |||||||||
| 1620 | Total | 2,954 | 2,573 | 2,610 | 2,405 | 2,405 | -549 | -18.6% | 0 | 0.0% | |||||||||
| 1621 | |||||||||||||||||||
| 1622 | |||||||||||||||||||
| 1623 | |||||||||||||||||||
| 1624 | |||||||||||||||||||
| 1625 | 7/25/2017 | Office of Planning and Research | |||||||||||||||||
| 1626 | |||||||||||||||||||
| 1627 | Spring Enrollment History 2013-2017 by Parish | ||||||||||||||||||
| 1628 | |||||||||||||||||||
| 1629 | |||||||||||||||||||
| 1630 | |||||||||||||||||||
| 1631 | Number | % | Number | % | |||||||||||||||
| 1632 | Change | Change | Change | Change | |||||||||||||||
| 1633 | Charity School of Nursing | Spring | Spring | Spring | Spring | Spring | 2013 | 2013 | 2016 | 2016 | |||||||||
| 1634 | Parish | 2013 | 2014 | 2015 | 2016 | 2017 | to 2017 | to 2017 | to 2017 | to 2017 | |||||||||
| 1635 | Jefferson | 214 | 226 | 245 | 231 | 209 | -5 | -2.3% | -22 | -9.5% | |||||||||
| 1636 | Orleans | 182 | 200 | 181 | 191 | 197 | 15 | 8.2% | 6 | 3.1% | |||||||||
| 1637 | St. Tammany | 114 | 145 | 134 | 140 | 156 | 42 | 36.8% | 16 | 11.4% | |||||||||
| 1638 | St. Bernard | 24 | 17 | 20 | 18 | 24 | 0 | 0.0% | 6 | 33.3% | |||||||||
| 1639 | St. Charles | 19 | 19 | 23 | 20 | 22 | 3 | 15.8% | 2 | 10.0% | |||||||||
| 1640 | St. John | 11 | 13 | 17 | 17 | 13 | 2 | 18.2% | -4 | -23.5% | |||||||||
| 1641 | Tangipahoa | 13 | 21 | 19 | 14 | 9 | -4 | -30.8% | -5 | -35.7% | |||||||||
| 1642 | Terrebonne | 7 | 11 | 12 | 9 | 9 | 2 | 28.6% | 0 | 0.0% | |||||||||
| 1643 | Plaquemines | 13 | 11 | 11 | 10 | 9 | -4 | -30.8% | -1 | -10.0% | |||||||||
| 1644 | Lafourche | 7 | 5 | 4 | 4 | 7 | 0 | 0.0% | 3 | 75.0% | |||||||||
| 1645 | Washington | 7 | 10 | 8 | 7 | 3 | -4 | -57.1% | -4 | -57.1% | |||||||||
| 1646 | Other | 41 | 37 | 38 | 40 | 39 | -2 | -4.9% | -1 | -2.5% | |||||||||
| 1647 | Total | 652 | 715 | 712 | 701 | 697 | 45 | 6.9% | -4 | -0.6% | |||||||||
| 1648 | |||||||||||||||||||
| 1649 | |||||||||||||||||||
| 1650 | |||||||||||||||||||
| 1651 | Northshore Site - Total | ||||||||||||||||||
|---|---|---|---|---|---|---|---|---|---|---|---|---|---|---|---|---|---|---|---|
| 1652 | St. Tammany | 1,869 | 1,464 | 1,268 | 1,170 | 1,170 | -699 | -37.4% | 0 | 0.0% | |||||||||
| 1653 | Tangipahoa | 341 | 210 | 90 | 64 | 64 | -277 | -81.2% | 0 | 0.0% | |||||||||
| 1654 | Orleans | 121 | 112 | 83 | 54 | 54 | -67 | -55.4% | 0 | 0.0% | |||||||||
| 1655 | Washington | 217 | 113 | 73 | 45 | 45 | -172 | -79.3% | 0 | 0.0% | |||||||||
| 1656 | Jefferson | 100 | 80 | 58 | 45 | 45 | -55 | -55.0% | 0 | 0.0% | |||||||||
| 1657 | St. Bernard | 42 | 26 | 22 | 15 | 15 | -27 | -64.3% | 0 | 0.0% | |||||||||
| 1658 | Livingston | 35 | 30 | 18 | 8 | 8 | -27 | -77.1% | 0 | 0.0% | |||||||||
| 1659 | St. Charles | 12 | 9 | 10 | 5 | 5 | -7 | -58.3% | 0 | 0.0% | |||||||||
| 1660 | Terrebonne | 8 | 5 | 5 | 7 | 7 | -1 | -12.5% | 0 | 0.0% | |||||||||
| 1661 | St. John | 8 | 9 | 5 | 5 | 5 | -3 | -37.5% | 0 | 0.0% | |||||||||
| 1662 | Lafourche | 4 | 2 | 3 | 1 | 1 | -3 | n/a | 0 | 0.0% | |||||||||
| 1663 | Plaquemines | 5 | 4 | 2 | 3 | 3 | -2 | -40.0% | 0 | 0.0% | |||||||||
| 1664 | Other | 179 | 149 | 115 | 78 | 78 | -101 | -56.4% | 0 | 0.0% | |||||||||
| 1665 | Total | 2,941 | 2,213 | 1,752 | 1,500 | 1,500 | -1,441 | -49.0% | 0 | 0.0% | |||||||||
| 1666 | |||||||||||||||||||
| 1667 | |||||||||||||||||||
| 1668 | |||||||||||||||||||
| 1669 | Technical Site - Total | ||||||||||||||||||
| 1670 | Jefferson | 323 | 377 | 352 | 477 | 430 | 107 | 33.1% | -47 | -9.9% | |||||||||
| 1671 | Orleans | 208 | 228 | 177 | 215 | 188 | -20 | -9.6% | -27 | -12.6% | |||||||||
| 1672 | St. Tammany | 16 | 16 | 20 | 37 | 32 | 16 | 100.0% | -5 | -13.5% | |||||||||
| 1673 | St. Charles | 17 | 23 | 24 | 33 | 29 | 12 | 70.6% | -4 | -12.1% | |||||||||
| 1674 | Plaquemines | 5 | 7 | 7 | 9 | 17 | 12 | 240.0% | 8 | 88.9% | |||||||||
| 1675 | St. John | 15 | 19 | 17 | 18 | 16 | 1 | 6.7% | -2 | -11.1% | |||||||||
| 1676 | St. Bernard | 4 | 7 | 7 | 12 | 6 | 2 | 50.0% | -6 | -50.0% | |||||||||
| 1677 | Tangipahoa | 4 | 4 | 5 | 5 | 6 | 2 | 50.0% | 1 | 20.0% | |||||||||
| 1678 | East Baton Rouge | 4 | 3 | 5 | 4 | 2 | -2 | -50.0% | -2 | -50.0% | |||||||||
| 1679 | St. James | 3 | 3 | 4 | 5 | 2 | -1 | -33.3% | -3 | -60.0% | |||||||||
| 1680 | Other | 40 | 35 | 35 | 54 | 58 | 18 | 45.0% | 4 | 7.4% | |||||||||
| 1681 | Total | 639 | 722 | 653 | 869 | 786 | 147 | 23.0% | -83 | -9.6% | |||||||||
| 1682 | |||||||||||||||||||
| 1683 | |||||||||||||||||||
| 1684 | |||||||||||||||||||
| 1685 | Sidney Collier Site | ||||||||||||||||||
| 1686 | Orleans | 214 | 339 | 294 | -45 | -13.3% | |||||||||||||
| 1687 | Jefferson | 54 | 151 | 119 | -32 | -21.2% | |||||||||||||
| 1688 | St. Tammany | 10 | 41 | 51 | 10 | 24.4% | |||||||||||||
| 1689 | St. Bernard | 5 | 8 | 15 | 7 | 87.5% | |||||||||||||
| 1690 | St. Charles | 4 | 15 | 13 | -2 | -13.3% | |||||||||||||
| 1691 | East Baton Rouge | 1 | 3 | 6 | 3 | 100.0% | |||||||||||||
| 1692 | St. John | n/a | n/a | 6 | n/a | n/a | |||||||||||||
| 1693 | Tangipahoa | 3 | 5 | 5 | 0 | 0.0% | |||||||||||||
| 1694 | Plaquemines | 3 | 7 | 2 | -5 | -71.4% | |||||||||||||
| 1695 | Other | 5 | 31 | 24 | -7 | -22.6% | |||||||||||||
| 1696 | Total | 299 | 600 | 535 | -65 | -10.8% | |||||||||||||
| 1697 | |||||||||||||||||||
| 1698 | |||||||||||||||||||
| 1699 | |||||||||||||||||||
| 1700 | |||||||||||||||||||
| 1701 | |||||||||||||||||||
| 1702 | 7/25/2017 | Office of Planning and Research | |||||||||||||||||
| 1703 | |||||||||||||||||||
| A | B | C | D | E | F | G | H | I | J | K | L | M | N | |
|---|---|---|---|---|---|---|---|---|---|---|---|---|---|---|
| 1 | ||||||||||||||
| 2 | Spring Enrollment History 2013-2017 by Zip Code (zip code order) | |||||||||||||
| 3 | ||||||||||||||
| 4 | ||||||||||||||
| 5 | Number | % | Number | % | ||||||||||
| 6 | College Wide | Change | Change | Change | Change | |||||||||
| 7 | Zip | Spring | Spring | Spring | Spring | Spring | 2013 | 2013 | 2016 | 2016 | ||||
| 8 | Code | 2013 | 2014 | 2015 | 2016 | 2017 | to 2017 | to 2017 | to 2017 | to 2017 | ||||
| 9 | Metairie S of I-10 | 70001 | 579 | 538 | 532 | 546 | 496 | -83 | -14.3% | -50 | -9.2% | |||
| 10 | Metairie | 70002 | 255 | 222 | 253 | 230 | 190 | -65 | -25.5% | -40 | -17.4% | |||
| 11 | West Metairie | 70003 | 599 | 535 | 495 | 521 | 451 | -148 | -24.7% | -70 | -13.4% | |||
| 12 | Old Metairie-Bucktown | 70005 | 304 | 260 | 272 | 253 | 207 | -97 | -31.9% | -46 | -18.2% | |||
| 13 | Metairie Clearview N of I-10 | 70006 | 203 | 205 | 208 | 205 | 184 | -19 | -9.4% | -21 | -10.2% | |||
| 14 | Belle Chasse | 70037 | 191 | 180 | 200 | 205 | 261 | 70 | 36.6% | 56 | 27.3% | |||
| 15 | Chalmette | 70043 | 145 | 153 | 167 | 167 | 130 | -15 | -10.3% | -37 | -22.2% | |||
| 16 | Destrehan | 70047 | 171 | 140 | 136 | 101 | 93 | -78 | -45.6% | -8 | -7.9% | |||
| 17 | Gretna | 70053 | 197 | 184 | 211 | 202 | 211 | 14 | 7.1% | 9 | 4.5% | |||
| 18 | Gretna/S of Whitney | 70056 | 806 | 775 | 826 | 787 | 665 | -141 | -17.5% | -122 | -15.5% | |||
| 19 | Harvey | 70058 | 896 | 838 | 817 | 760 | 739 | -157 | -17.5% | -21 | -2.8% | |||
| 20 | South Kenner | 70062 | 210 | 207 | 211 | 227 | 199 | -11 | -5.2% | -28 | -12.3% | |||
| 21 | North Kenner | 70065 | 814 | 754 | 733 | 717 | 626 | -188 | -23.1% | -91 | -12.7% | |||
| 22 | LaPlace | 70068 | 336 | 295 | 315 | 328 | 265 | -71 | -21.1% | -63 | -19.2% | |||
| 23 | Luling | 70070 | 114 | 96 | 96 | 101 | 96 | -18 | -15.8% | -5 | -5.0% | |||
| 24 | Marrero | 70072 | 955 | 925 | 926 | 871 | 869 | -86 | -9.0% | -2 | -0.2% | |||
| 25 | Saint Rose | 70087 | 123 | 106 | 108 | 112 | 105 | -18 | -14.6% | -7 | -6.3% | |||
| 26 | Westwego | 70094 | 504 | 468 | 475 | 460 | 445 | -59 | -11.7% | -15 | -3.3% | |||
| 27 | Central City | 70113 | 77 | 105 | 127 | 105 | 99 | 22 | 28.6% | -6 | -5.7% | |||
| 28 | Algiers | 70114 | 428 | 415 | 446 | 432 | 367 | -61 | -14.3% | -65 | -15.0% | |||
| 29 | Uptown | 70115 | 341 | 296 | 308 | 264 | 231 | -110 | -32.3% | -33 | -12.5% | |||
| 30 | French Quarter-Marigny | 70116 | 140 | 120 | 152 | 125 | 110 | -30 | -21.4% | -15 | -12.0% | |||
| 31 | Bywater/ Lower 9th Ward | 70117 | 391 | 398 | 425 | 415 | 351 | -40 | -10.2% | -64 | -15.4% | |||
| 32 | Carrollton/Riverbend | 70118 | 353 | 324 | 333 | 282 | 264 | -89 | -25.2% | -18 | -6.4% | |||
| 33 | Mid City | 70119 | 580 | 593 | 600 | 573 | 504 | -76 | -13.1% | -69 | -12.0% | |||
| 34 | N.O. Postal Box Zone | 70121 | 149 | 148 | 146 | 142 | 126 | -23 | -15.4% | -16 | -11.3% | |||
| 35 | Lakefront/Gentilly | 70122 | 580 | 597 | 613 | 581 | 573 | -7 | -1.2% | -8 | -1.4% | |||
| 36 | Harahan-Jefferson | 70123 | 296 | 279 | 278 | 249 | 249 | -47 | -15.9% | 0 | 0.0% | |||
| 37 | Lakefront/Lakeview | 70124 | 214 | 179 | 169 | 151 | 126 | -88 | -41.1% | -25 | -16.6% | |||
| 38 | Broadmoor | 70125 | 206 | 183 | 222 | 207 | 198 | -8 | -3.9% | -9 | -4.3% | |||
| 39 | N.O. East Crowder | 70126 | 491 | 525 | 591 | 488 | 532 | 41 | 8.4% | 44 | 9.0% | |||
| 40 | N.O. East Crowder to Wright Rd | 70127 | 412 | 411 | 522 | 465 | 452 | 40 | 9.7% | -13 | -2.8% | |||
| 41 | N.O. East Wright Rd to I-510 | 70128 | 323 | 338 | 370 | 372 | 338 | 15 | 4.6% | -34 | -9.1% | |||
| 42 | N.O. East Past I-510 | 70129 | 148 | 172 | 161 | 160 | 149 | 1 | 0.7% | -11 | -6.9% | |||
| 43 | N.O. CBD Lower Garden District | 70130 | 155 | 149 | 119 | 125 | 119 | -36 | -23.2% | -6 | -4.8% | |||
| 44 | Lower Coast Algiers | 70131 | 488 | 497 | 523 | 472 | 445 | -43 | -8.8% | -27 | -5.7% | |||
| 45 | Hammond | 70401 | 174 | 52 | 32 | 31 | 23 | -151 | -86.8% | -8 | -25.8% | |||
| 46 | Hammond | 70403 | 98 | 78 | 60 | 42 | 37 | -61 | -62.2% | -5 | -11.9% | |||
| 47 | Abita Springs | 70420 | 116 | 71 | 47 | 49 | 36 | -80 | -69.0% | -13 | -26.5% | |||
| 48 | Bogalusa | 70427 | 341 | 67 | 56 | 38 | 23 | -318 | -93.3% | -15 | -39.5% | |||
| 49 | Covington | 70433 | 174 | 268 | 188 | 162 | 136 | -38 | -21.8% | -26 | -16.0% | |||
| 50 | Covington | 70435 | 109 | 126 | 106 | 89 | 75 | -34 | -31.2% | -14 | -15.7% | |||
| 51 | Lacombe | 70445 | 116 | 113 | 96 | 82 | 60 | -56 | -48.3% | -22 | -26.8% | |||
|---|---|---|---|---|---|---|---|---|---|---|---|---|---|---|
| 52 | Mandeville | 70448 | 216 | 170 | 156 | 132 | 104 | -112 | -51.9% | -28 | -21.2% | |||
| 53 | Pearl River | 70452 | 149 | 150 | 136 | 139 | 103 | -46 | -30.9% | -36 | -25.9% | |||
| 54 | Ponchatoula | 70454 | 121 | 118 | 87 | 55 | 48 | -73 | -60.3% | -7 | -12.7% | |||
| 55 | Slidell | 70458 | 595 | 530 | 513 | 464 | 323 | -272 | -45.7% | -141 | -30.4% | |||
| 56 | Slidell | 70460 | 356 | 303 | 339 | 304 | 222 | -134 | -37.6% | -82 | -27.0% | |||
| 57 | Slidell | 70461 | 430 | 413 | 419 | 394 | 278 | -152 | -35.3% | -116 | -29.4% | |||
| 58 | Mandeville | 70471 | 175 | 165 | 133 | 111 | 100 | -75 | -42.9% | -11 | -9.9% | |||
| 59 | Subtotal | 16,344 | 15,234 | 15,454 | 14,493 | 13,033 | -3,311 | -20.3% | -1,460 | -10.1% | ||||
| 60 | Other Louisiana | 1,740 | 1,565 | 1,423 | 1,378 | 1,210 | -530 | -30.5% | -168 | -12.2% | ||||
| 61 | Total Louisiana | 18,084 | 16,799 | 16,877 | 15,871 | 14,243 | -3,841 | -21.2% | -1,628 | -10.3% | ||||
| 62 | Out-of-State/Unknown | 132 | 126 | 139 | 104 | 88 | -44 | -33.3% | -16 | -15.4% | ||||
| 63 | Total | 18,216 | 16,925 | 17,016 | 15,975 | 14,331 | -3,885 | -21.3% | -1,644 | -10.3% | ||||
| 64 | ||||||||||||||
| 65 | ||||||||||||||
| 66 | ||||||||||||||
| 67 | 7/25/2017 | Office of Planning and Research | ||||||||||||
| 68 | ||||||||||||||
| 69 | Spring Enrollment History 2013-2017 by Zip Code (zip code order) | |||||||||||||
| 70 | ||||||||||||||
| 71 | ||||||||||||||
| 72 | ||||||||||||||
| 73 | ||||||||||||||
| 74 | Number | % | Number | % | ||||||||||
| 75 | Change | Change | Change | Change | ||||||||||
| 76 | City Park Campus | Zip | Spring | Spring | Spring | Spring | Spring | 2013 | 2013 | 2016 | 2016 | |||
| 77 | Code | 2013 | 2014 | 2015 | 2016 | 2017 | to 2017 | to 2017 | to 2017 | to 2017 | ||||
| 78 | Metairie S of I-10 | 70001 | 508 | 471 | 460 | 442 | 406 | -102 | -20.1% | -36 | -8.1% | |||
| 79 | Metairie | 70002 | 230 | 197 | 226 | 192 | 160 | -70 | -30.4% | -32 | -16.7% | |||
| 80 | West Metairie | 70003 | 532 | 467 | 435 | 414 | 352 | -180 | -33.8% | -62 | -15.0% | |||
| 81 | Old Metairie-Bucktown | 70005 | 267 | 231 | 240 | 201 | 171 | -96 | -36.0% | -30 | -14.9% | |||
| 82 | Metairie Clearview N of I-10 | 70006 | 175 | 181 | 170 | 151 | 144 | -31 | -17.7% | -7 | -4.6% | |||
| 83 | Belle Chasse | 70037 | 48 | 53 | 82 | 71 | 83 | 35 | 72.9% | 12 | 16.9% | |||
| 84 | Chalmette | 70043 | 125 | 128 | 134 | 118 | 82 | -43 | -34.4% | -36 | -30.5% | |||
| 85 | Destrehan | 70047 | 155 | 124 | 121 | 85 | 76 | -79 | -51.0% | -9 | -10.6% | |||
| 86 | Gretna | 70053 | 75 | 83 | 93 | 86 | 85 | 10 | 13.3% | -1 | -1.2% | |||
| 87 | Gretna/S of Whitney | 70056 | 279 | 334 | 364 | 330 | 284 | 5 | 1.8% | -46 | -13.9% | |||
| 88 | Harvey | 70058 | 328 | 331 | 318 | 291 | 289 | -39 | -11.9% | -2 | -0.7% | |||
| 89 | South Kenner | 70062 | 174 | 171 | 167 | 179 | 166 | -8 | -4.6% | -13 | -7.3% | |||
| 90 | North Kenner | 70065 | 730 | 667 | 639 | 613 | 532 | -198 | -27.1% | -81 | -13.2% | |||
| 91 | LaPlace | 70068 | 299 | 260 | 270 | 279 | 223 | -76 | -25.4% | -56 | -20.1% | |||
| 92 | Luling | 70070 | 95 | 72 | 69 | 82 | 71 | -24 | -25.3% | -11 | -13.4% | |||
| 93 | Marrero | 70072 | 334 | 343 | 348 | 323 | 312 | -22 | -6.6% | -11 | -3.4% | |||
| 94 | Saint Rose | 70087 | 110 | 96 | 98 | 92 | 86 | -24 | -21.8% | -6 | -6.5% | |||
| 95 | Westwego | 70094 | 217 | 208 | 222 | 223 | 208 | -9 | -4.1% | -15 | -6.7% | |||
| 96 | Central City | 70113 | 64 | 90 | 116 | 91 | 87 | 23 | 35.9% | -4 | -4.4% | |||
| 97 | Algiers | 70114 | 120 | 121 | 148 | 116 | 105 | -15 | -12.5% | -11 | -9.5% | |||
| 98 | Uptown | 70115 | 293 | 258 | 271 | 213 | 198 | -95 | -32.4% | -15 | -7.0% | |||
| 99 | French Quarter-Marigny | 70116 | 134 | 112 | 138 | 104 | 96 | -38 | -28.4% | -8 | -7.7% | |||
| 100 | Bywater/ Lower 9th Ward | 70117 | 353 | 357 | 360 | 341 | 283 | -70 | -19.8% | -58 | -17.0% | |||
| 101 | Carrollton/Riverbend | 70118 | 315 | 295 | 302 | 236 | 228 | -87 | -27.6% | -8 | -3.4% | |||
|---|---|---|---|---|---|---|---|---|---|---|---|---|---|---|
| 102 | Mid City | 70119 | 543 | 537 | 540 | 494 | 415 | -128 | -23.6% | -79 | -16.0% | |||
| 103 | N.O. Postal Box Zone | 70121 | 132 | 130 | 121 | 110 | 106 | -26 | -19.7% | -4 | -3.6% | |||
| 104 | Lakefront/Gentilly | 70122 | 525 | 548 | 532 | 492 | 485 | -40 | -7.6% | -7 | -1.4% | |||
| 105 | Harahan-Jefferson | 70123 | 248 | 231 | 236 | 207 | 202 | -46 | -18.5% | -5 | -2.4% | |||
| 106 | Lakefront/Lakeview | 70124 | 194 | 152 | 146 | 123 | 108 | -86 | -44.3% | -15 | -12.2% | |||
| 107 | Broadmoor | 70125 | 185 | 156 | 191 | 181 | 168 | -17 | -9.2% | -13 | -7.2% | |||
| 108 | N.O. East Crowder | 70126 | 438 | 477 | 502 | 397 | 427 | -11 | -2.5% | 30 | 7.6% | |||
| 109 | N.O. East Crowder to Wright Rd | 70127 | 380 | 377 | 445 | 371 | 364 | -16 | -4.2% | -7 | -1.9% | |||
| 110 | N.O. East Wright Rd to I-510 | 70128 | 291 | 308 | 329 | 312 | 285 | -6 | -2.1% | -27 | -8.7% | |||
| 111 | N.O. East Past I-510 | 70129 | 128 | 144 | 139 | 132 | 125 | -3 | -2.3% | -7 | -5.3% | |||
| 112 | N.O. CBD Lower Garden District | 70130 | 141 | 132 | 101 | 102 | 103 | -38 | -27.0% | 1 | 1.0% | |||
| 113 | Lower Coast Algiers | 70131 | 179 | 186 | 204 | 178 | 162 | -17 | -9.5% | -16 | -9.0% | |||
| 114 | Hammond | 70401 | 31 | 35 | 43 | 34 | 20 | -11 | -35.5% | -14 | -41.2% | |||
| 115 | Abita Springs | 70420 | 11 | 12 | 8 | 13 | 28 | 17 | 154.5% | 15 | 115.4% | |||
| 116 | Bogalusa | 70427 | 14 | 11 | 20 | 15 | 22 | 8 | 57.1% | 7 | 46.7% | |||
| 117 | Covington | 70433 | 58 | 67 | 74 | 77 | 111 | 53 | 91.4% | 34 | 44.2% | |||
| 118 | Covington | 70435 | 25 | 28 | 35 | 24 | 64 | 39 | 156.0% | 40 | 166.7% | |||
| 119 | Lacombe | 70445 | 18 | 20 | 22 | 15 | 48 | 30 | 166.7% | 33 | 220.0% | |||
| 120 | Mandeville | 70448 | 66 | 53 | 77 | 60 | 84 | 18 | 27.3% | 24 | 40.0% | |||
| 121 | Pearl River | 70452 | 10 | 26 | 18 | 22 | 89 | 79 | 790.0% | 67 | 304.5% | |||
| 122 | Ponchatoula | 70454 | 29 | 37 | 43 | 27 | 42 | 13 | 44.8% | 15 | 55.6% | |||
| 123 | Slidell | 70458 | 114 | 134 | 111 | 111 | 257 | 143 | 125.4% | 146 | 131.5% | |||
| 124 | Slidell | 70460 | 76 | 68 | 59 | 62 | 188 | 112 | 147.4% | 126 | 203.2% | |||
| 125 | Slidell | 70461 | 81 | 109 | 103 | 92 | 235 | 154 | 190.1% | 143 | 155.4% | |||
| 126 | Mandeville | 70471 | 47 | 61 | 65 | 47 | 83 | 36 | 76.6% | 36 | 76.6% | |||
| 127 | Subtotal | 9,877 | 9,628 | 9,890 | 8,924 | 8,948 | -929 | -9.4% | 24 | 0.3% | ||||
| 128 | Other Louisiana | 1,023 | 992 | 1,014 | 909 | 921 | -102 | -10.0% | 12 | 1.3% | ||||
| 129 | Total Louisiana | 10,900 | 10,620 | 10,904 | 9,833 | 9,869 | -1,031 | -9.5% | 36 | 0.4% | ||||
| 130 | Out-of-State/Unknown | 83 | 82 | 86 | 67 | 69 | -14 | -16.9% | 2 | 3.0% | ||||
| 131 | Total | 10,983 | 10,702 | 10,990 | 9,900 | 9,938 | -1,045 | -9.5% | 38 | 0.4% | ||||
| 132 | ||||||||||||||
| 133 | ||||||||||||||
| 134 | ||||||||||||||
| 135 | 7/25/2017 | Office of Planning and Research | ||||||||||||
| 136 | ||||||||||||||
| 137 | Spring Enrollment History 2013-2017 by Zip Code (zip code order) | |||||||||||||
| 138 | ||||||||||||||
| 139 | ||||||||||||||
| 140 | ||||||||||||||
| 141 | ||||||||||||||
| 142 | Number | % | Number | % | ||||||||||
| 143 | Change | Change | Change | Change | ||||||||||
| 144 | West Bank Campus | Zip | Spring | Spring | Spring | Spring | Spring | 2013 | 2013 | 2016 | 2016 | |||
| 145 | Code | 2013 | 2014 | 2015 | 2016 | 2017 | to 2017 | to 2017 | to 2017 | to 2017 | ||||
| 146 | Metairie S of I-10 | 70001 | 14 | 9 | 6 | 6 | 12 | -2 | -14.3% | 6 | 100.0% | |||
| 147 | Metairie | 70002 | 6 | 6 | 8 | 1 | 1 | -5 | -83.3% | 0 | 0.0% | |||
| 148 | West Metairie | 70003 | 6 | 8 | 6 | 4 | 7 | 1 | 16.7% | 3 | 75.0% | |||
| 149 | Old Metairie-Bucktown | 70005 | 5 | 1 | 0 | 3 | 5 | 0 | 0.0% | 2 | 66.7% | |||
| 150 | Metairie Clearview N of I-10 | 70006 | 4 | 5 | 4 | 1 | 3 | -1 | -25.0% | 2 | 200.0% | |||
| 151 | Belle Chasse | 70037 | 121 | 114 | 103 | 107 | 154 | 33 | 27.3% | 47 | 43.9% | |||
|---|---|---|---|---|---|---|---|---|---|---|---|---|---|---|
| 152 | Chalmette | 70043 | 6 | 8 | 9 | 10 | 8 | 2 | 33.3% | -2 | -20.0% | |||
| 153 | Destrehan | 70047 | 1 | 1 | 2 | 1 | 0 | -1 | -100.0% | -1 | -100.0% | |||
| 154 | Gretna | 70053 | 108 | 77 | 97 | 98 | 106 | -2 | -1.9% | 8 | 8.2% | |||
| 155 | Gretna/S of Whitney | 70056 | 456 | 365 | 378 | 363 | 307 | -149 | -32.7% | -56 | -15.4% | |||
| 156 | Harvey | 70058 | 498 | 419 | 429 | 369 | 366 | -132 | -26.5% | -3 | -0.8% | |||
| 157 | South Kenner | 70062 | 2 | 4 | 6 | 4 | 4 | 2 | 100.0% | 0 | 0.0% | |||
| 158 | North Kenner | 70065 | 12 | 9 | 6 | 8 | 10 | -2 | -16.7% | 2 | 25.0% | |||
| 159 | Jean Lafitte | 70067 | 17 | 22 | 18 | 19 | 13 | -4 | -23.5% | -6 | -31.6% | |||
| 160 | LaPlace | 70068 | 5 | 2 | 4 | 10 | 10 | 5 | 100.0% | 0 | 0.0% | |||
| 161 | Luling | 70070 | 13 | 19 | 18 | 10 | 11 | -2 | -15.4% | 1 | 10.0% | |||
| 162 | Marrero | 70072 | 533 | 478 | 472 | 428 | 428 | -105 | -19.7% | 0 | 0.0% | |||
| 163 | Plaquemines | 70083 | 15 | 12 | 16 | 12 | 7 | -8 | -53.3% | -5 | -41.7% | |||
| 164 | Westwego | 70094 | 237 | 203 | 204 | 170 | 181 | -56 | -23.6% | 11 | 6.5% | |||
| 165 | Algiers | 70114 | 285 | 267 | 269 | 283 | 229 | -56 | -19.6% | -54 | -19.1% | |||
| 166 | Uptown | 70115 | 14 | 12 | 11 | 8 | 4 | -10 | -71.4% | -4 | -50.0% | |||
| 167 | French Quarter-Marigny | 70116 | 1 | 4 | 4 | 3 | 3 | 2 | 200.0% | 0 | 0.0% | |||
| 168 | Bywater/ Lower 9th Ward | 70117 | 12 | 12 | 12 | 9 | 12 | 0 | 0.0% | 3 | 33.3% | |||
| 169 | Carrollton/Riverbend | 70118 | 16 | 8 | 11 | 10 | 10 | -6 | -37.5% | 0 | 0.0% | |||
| 170 | Mid City | 70119 | 14 | 13 | 12 | 10 | 13 | -1 | -7.1% | 3 | 30.0% | |||
| 171 | N.O. Postal Box Zone | 70121 | 4 | 2 | 2 | 0 | 1 | -3 | -75.0% | 1 | n/a | |||
| 172 | Lakefront/Gentilly | 70122 | 19 | 11 | 19 | 14 | 15 | -4 | -21.1% | 1 | 7.1% | |||
| 173 | Harahan-Jefferson | 70123 | 8 | 6 | 2 | 0 | 4 | -4 | -50.0% | 4 | n/a | |||
| 174 | Lakefront/Lakeview | 70124 | 3 | 5 | 4 | 4 | 2 | -1 | -33.3% | -2 | -50.0% | |||
| 175 | Broadmoor | 70125 | 9 | 7 | 12 | 5 | 7 | -2 | -22.2% | 2 | 40.0% | |||
| 176 | N.O. East Crowder | 70126 | 20 | 15 | 11 | 11 | 11 | -9 | -45.0% | 0 | 0.0% | |||
| 177 | N.O. East Crowder to Wright Rd | 70127 | 10 | 4 | 10 | 12 | 14 | 4 | 40.0% | 2 | 16.7% | |||
| 178 | N.O. East Wright Rd to I-510 | 70128 | 7 | 6 | 16 | 13 | 15 | 8 | 114.3% | 2 | 15.4% | |||
| 179 | N.O. East Past I-510 | 70129 | 5 | 5 | 2 | 5 | 2 | -3 | -60.0% | -3 | -60.0% | |||
| 180 | N.O. CBD Lower Garden District | 70130 | 7 | 9 | 5 | 9 | 7 | 0 | 0.0% | -2 | -22.2% | |||
| 181 | Lower Coast Algiers | 70131 | 282 | 271 | 277 | 239 | 236 | -46 | -16.3% | -3 | -1.3% | |||
| 182 | Covington | 70433 | 5 | 1 | 2 | 0 | 1 | -4 | -80.0% | 1 | n/a | |||
| 183 | Covington | 70435 | 2 | 1 | 1 | 1 | 2 | 0 | 0.0% | 1 | 100.0% | |||
| 184 | Mandeville | 70448 | 0 | 1 | 0 | 0 | 0 | 0 | n/a | 0 | n/a | |||
| 185 | Pearl River | 70452 | 0 | 0 | 0 | 3 | 5 | 5 | n/a | 2 | 66.7% | |||
| 186 | Slidell | 70458 | 6 | 4 | 2 | 0 | 5 | -1 | -16.7% | 5 | n/a | |||
| 187 | Slidell | 70460 | 1 | 0 | 3 | 2 | 10 | 9 | 900.0% | 8 | 400.0% | |||
| 188 | Slidell | 70461 | 9 | 2 | 1 | 0 | 3 | -6 | -66.7% | 3 | n/a | |||
| 189 | Mandeville | 70471 | 0 | 1 | 3 | 0 | 1 | 1 | n/a | 1 | n/a | |||
| 190 | Subtotal | 2,798 | 2,428 | 2,474 | 2,265 | 2,245 | -553 | -19.8% | -20 | -0.9% | ||||
| 191 | Other Louisiana | 151 | 137 | 136 | 133 | 124 | -27 | -17.9% | -9 | -6.8% | ||||
| 192 | Total Louisiana | 2,949 | 2,565 | 2,610 | 2,398 | 2,369 | -580 | -19.7% | -29 | -1.2% | ||||
| 193 | Out-of-State/Unknown | 5 | 8 | 7 | 7 | 6 | 1 | 20.0% | -1 | -14.3% | ||||
| 194 | Total | 2,954 | 2,573 | 2,617 | 2,405 | 2,375 | -579 | -19.6% | -30 | -1.2% | ||||
| 195 | ||||||||||||||
| 196 | ||||||||||||||
| 197 | ||||||||||||||
| 198 | 7/25/2017 | Office of Planning and Research | ||||||||||||
| 199 | ||||||||||||||
| 200 | Spring Enrollment History 2013-2017 by Zip Code (zip code order) | |||||||||||||
| 201 | ||||||||||||||
|---|---|---|---|---|---|---|---|---|---|---|---|---|---|---|
| 202 | ||||||||||||||
| 203 | ||||||||||||||
| 204 | ||||||||||||||
| 205 | Number | % | Number | % | ||||||||||
| 206 | Change | Change | Change | Change | ||||||||||
| 207 | Charity School of Nursing | Zip | Spring | Spring | Spring | Spring | Spring | 2013 | 2013 | 2016 | 2016 | |||
| 208 | Code | 2013 | 2014 | 2015 | 2016 | 2017 | to 2017 | to 2017 | to 2017 | to 2017 | ||||
| 209 | Metairie S of I-10 | 70001 | 33 | 31 | 29 | 25 | 22 | -11 | -33.3% | -3 | -12.0% | |||
| 210 | Metairie | 70002 | 7 | 7 | 8 | 12 | 9 | 2 | 28.6% | -3 | -25.0% | |||
| 211 | West Metairie | 70003 | 28 | 28 | 25 | 27 | 21 | -7 | -25.0% | -6 | -22.2% | |||
| 212 | Old Metairie-Bucktown | 70005 | 18 | 17 | 18 | 16 | 14 | -4 | -22.2% | -2 | -12.5% | |||
| 213 | Metairie Clearview N of I-10 | 70006 | 12 | 6 | 11 | 13 | 14 | 2 | 16.7% | 1 | 7.7% | |||
| 214 | Belle Chasse | 70037 | 15 | 10 | 5 | 8 | 7 | -8 | -53.3% | -1 | -12.5% | |||
| 215 | Chalmette | 70043 | 8 | 8 | 9 | 13 | 23 | 15 | 187.5% | 10 | 76.9% | |||
| 216 | Destrehan | 70047 | 5 | 4 | 6 | 5 | 5 | 0 | 0.0% | 0 | 0.0% | |||
| 217 | Gretna | 70053 | 5 | 9 | 7 | 4 | 6 | 1 | 20.0% | 2 | 50.0% | |||
| 218 | Gretna/S of Whitney | 70056 | 21 | 26 | 35 | 25 | 19 | -2 | -9.5% | -6 | -24.0% | |||
| 219 | Harvey | 70058 | 23 | 23 | 19 | 21 | 18 | -5 | -21.7% | -3 | -14.3% | |||
| 220 | South Kenner | 70062 | 11 | 15 | 13 | 10 | 5 | -6 | -54.5% | -5 | -50.0% | |||
| 221 | North Kenner | 70065 | 21 | 27 | 30 | 29 | 27 | 6 | 28.6% | -2 | -6.9% | |||
| 222 | LaPlace | 70068 | 16 | 16 | 17 | 15 | 10 | -6 | -37.5% | -5 | -33.3% | |||
| 223 | Marrero | 70072 | 27 | 24 | 38 | 31 | 37 | 10 | 37.0% | 6 | 19.4% | |||
| 224 | Westwego | 70094 | 17 | 16 | 10 | 14 | 15 | -2 | -11.8% | 1 | 7.1% | |||
| 225 | Algiers | 70114 | 5 | 5 | 7 | 7 | 13 | 8 | 160.0% | 6 | 85.7% | |||
| 226 | Uptown | 70115 | 17 | 14 | 13 | 13 | 8 | -9 | -52.9% | -5 | -38.5% | |||
| 227 | French Quarter-Marigny | 70116 | 1 | 2 | 1 | 2 | 4 | 3 | 300.0% | 2 | 100.0% | |||
| 228 | Bywater/ Lower 9th Ward | 70117 | 8 | 14 | 16 | 16 | 13 | 5 | 62.5% | -3 | -18.8% | |||
| 229 | Carrollton/Riverbend | 70118 | 7 | 6 | 3 | 10 | 9 | 2 | 28.6% | -1 | -10.0% | |||
| 230 | Mid City | 70119 | 12 | 24 | 22 | 22 | 33 | 21 | 175.0% | 11 | 50.0% | |||
| 231 | N.O. Postal Box Zone | 70121 | 6 | 6 | 8 | 8 | 2 | -4 | -66.7% | -6 | -75.0% | |||
| 232 | Lakefront/Gentilly | 70122 | 15 | 14 | 17 | 17 | 21 | 6 | 40.0% | 4 | 23.5% | |||
| 233 | Harahan-Jefferson | 70123 | 19 | 15 | 12 | 13 | 13 | -6 | -31.6% | 0 | 0.0% | |||
| 234 | Lakefront/Lakeview | 70124 | 10 | 13 | 11 | 9 | 10 | 0 | 0.0% | 1 | 11.1% | |||
| 235 | Broadmoor | 70125 | 4 | 9 | 8 | 5 | 6 | 2 | 50.0% | 1 | 20.0% | |||
| 236 | N.O. East Crowder | 70126 | 11 | 11 | 10 | 12 | 12 | 1 | 9.1% | 0 | 0.0% | |||
| 237 | N.O. East Crowder to Wright Rd | 70127 | 6 | 8 | 8 | 13 | 13 | 7 | 116.7% | 0 | 0.0% | |||
| 238 | N.O. East Wright Rd to I-510 | 70128 | 7 | 8 | 5 | 9 | 10 | 3 | 42.9% | 1 | 11.1% | |||
| 239 | N.O. East Past I-510 | 70129 | 7 | 7 | 5 | 4 | 7 | 0 | 0.0% | 3 | 75.0% | |||
| 240 | N.O. CBD Lower Garden District | 70130 | 3 | 3 | 6 | 6 | 1 | -2 | -66.7% | -5 | -83.3% | |||
| 241 | Lower Coast Algiers | 70131 | 12 | 20 | 18 | 20 | 14 | 2 | 16.7% | -6 | -30.0% | |||
| 242 | Abita Springs | 70420 | 6 | 10 | 11 | 3 | 1 | -5 | -83.3% | -2 | -66.7% | |||
| 243 | Covington | 70433 | 19 | 28 | 16 | 12 | 17 | -2 | -10.5% | 5 | 41.7% | |||
| 244 | Covington | 70435 | 14 | 14 | 8 | 6 | 6 | -8 | -57.1% | 0 | 0.0% | |||
| 245 | Lacombe | 70445 | 10 | 11 | 7 | 6 | 8 | -2 | -20.0% | 2 | 33.3% | |||
| 246 | Mandeville | 70448 | 11 | 12 | 15 | 15 | 13 | 2 | 18.2% | -2 | -13.3% | |||
| 247 | Pearl River | 70452 | 6 | 6 | 7 | 11 | 9 | 3 | 50.0% | -2 | -18.2% | |||
| 248 | Ponchatoula | 70454 | 7 | 14 | 7 | 3 | 3 | -4 | -57.1% | 0 | 0.0% | |||
| 249 | Slidell | 70458 | 31 | 30 | 32 | 27 | 32 | 1 | 3.2% | 5 | 18.5% | |||
| 250 | Slidell | 70460 | 13 | 16 | 17 | 14 | 18 | 5 | 38.5% | 4 | 28.6% | |||
| 251 | Slidell | 70461 | 12 | 17 | 23 | 25 | 27 | 15 | 125.0% | 2 | 8.0% | |||
|---|---|---|---|---|---|---|---|---|---|---|---|---|---|---|
| 252 | Mandeville | 70471 | 12 | 11 | 11 | 10 | 10 | -2 | -16.7% | 0 | 0.0% | |||
| 253 | Subtotal | 558 | 615 | 604 | 586 | 585 | 27 | 4.8% | -1 | -0.2% | ||||
| 254 | Other Louisiana | 88 | 95 | 104 | 112 | 109 | 21 | 23.9% | -3 | -2.7% | ||||
| 255 | Total Louisiana | 646 | 710 | 708 | 698 | 694 | 48 | 7.4% | -4 | -0.6% | ||||
| 256 | Out-of-State/Unknown | 6 | 5 | 4 | 3 | 3 | -3 | n/a | 0 | 0.0% | ||||
| 257 | Total | 652 | 715 | 712 | 701 | 697 | 45 | 6.9% | -4 | -0.6% | ||||
| 258 | ||||||||||||||
| 259 | ||||||||||||||
| 260 | ||||||||||||||
| 261 | ||||||||||||||
| 262 | ||||||||||||||
| 263 | 7/25/2017 | Office of Planning and Research | ||||||||||||
| 264 | ||||||||||||||
| 265 | Spring Enrollment History 2013-2017 by Zip Code (zip code order) | |||||||||||||
| 266 | ||||||||||||||
| 267 | ||||||||||||||
| 268 | ||||||||||||||
| 269 | ||||||||||||||
| 270 | Number | % | Number | % | ||||||||||
| 271 | Change | Change | Change | Change | ||||||||||
| 272 | Technical Site - Total | Zip | Spring | Spring | Spring | Spring | Spring | 2013 | 2013 | 2016 | 2016 | |||
| 273 | Code | 2013 | 2014 | 2015 | 2016 | 2017 | to 2017 | to 2017 | to 2017 | to 2017 | ||||
| 274 | Metairie S of I-10 | 70001 | 23 | 26 | 34 | 52 | 39 | 16 | 69.6% | -13 | -25.0% | |||
| 275 | Metairie | 70002 | 11 | 9 | 10 | 23 | 18 | 7 | 63.6% | -5 | -21.7% | |||
| 276 | West Metairie | 70003 | 29 | 28 | 29 | 63 | 58 | 29 | 100.0% | -5 | -7.9% | |||
| 277 | Old Metairie-Bucktown | 70005 | 11 | 10 | 10 | 24 | 14 | 3 | 27.3% | -10 | -41.7% | |||
| 278 | Metairie Clearview N of I-10 | 70006 | 10 | 12 | 21 | 32 | 19 | 9 | 90.0% | -13 | -40.6% | |||
| 279 | Belle Chasse | 70037 | 4 | 2 | 7 | 13 | 15 | 11 | 275.0% | 2 | 15.4% | |||
| 280 | Chalmette | 70043 | 2 | 3 | 2 | 9 | 6 | 4 | 200.0% | -3 | -33.3% | |||
| 281 | Destrehan | 70047 | 8 | 9 | 5 | 3 | 8 | 0 | 0.0% | 5 | 166.7% | |||
| 282 | Gretna | 70053 | 9 | 14 | 12 | 9 | 8 | -1 | -11.1% | -1 | -11.1% | |||
| 283 | Gretna/S of Whitney | 70056 | 46 | 47 | 34 | 43 | 39 | -7 | -15.2% | -4 | -9.3% | |||
| 284 | Harvey | 70058 | 41 | 62 | 41 | 52 | 52 | 11 | 26.8% | 0 | 0.0% | |||
| 285 | South Kenner | 70062 | 23 | 16 | 24 | 29 | 22 | -1 | -4.3% | -7 | -24.1% | |||
| 286 | North Kenner | 70065 | 46 | 44 | 46 | 51 | 45 | -1 | -2.2% | -6 | -11.8% | |||
| 287 | LaPlace | 70068 | 14 | 15 | 20 | 16 | 19 | 5 | 35.7% | 3 | 18.8% | |||
| 288 | Marrero | 70072 | 56 | 76 | 58 | 62 | 70 | 14 | 25.0% | 8 | 12.9% | |||
| 289 | Westwego | 70094 | 31 | 39 | 30 | 39 | 32 | 1 | 3.2% | -7 | -17.9% | |||
| 290 | Algiers | 70114 | 16 | 22 | 15 | 14 | 12 | -4 | -25.0% | -2 | -14.3% | |||
| 291 | Uptown | 70115 | 16 | 11 | 7 | 16 | 13 | -3 | -18.8% | -3 | -18.8% | |||
| 292 | French Quarter-Marigny | 70116 | 4 | 2 | 4 | 7 | 5 | 1 | 25.0% | -2 | -28.6% | |||
| 293 | Bywater/ Lower 9th Ward | 70117 | 15 | 14 | 9 | 8 | 10 | -5 | -33.3% | 2 | 25.0% | |||
| 294 | Carrollton/Riverbend | 70118 | 14 | 15 | 14 | 16 | 11 | -3 | -21.4% | -5 | -31.3% | |||
| 295 | Mid City | 70119 | 9 | 16 | 14 | 18 | 17 | 8 | 88.9% | -1 | -5.6% | |||
| 296 | N.O. Postal Box Zone | 70121 | 6 | 7 | 12 | 19 | 12 | 6 | 100.0% | -7 | -36.8% | |||
| 297 | Lakefront/Gentilly | 70122 | 18 | 17 | 15 | 19 | 19 | 1 | 5.6% | 0 | 0.0% | |||
| 298 | Harahan-Jefferson | 70123 | 21 | 24 | 24 | 22 | 27 | 6 | 28.6% | 5 | 22.7% | |||
| 299 | Lakefront/Lakeview | 70124 | 6 | 7 | 7 | 7 | 5 | -1 | -16.7% | -2 | -28.6% | |||
| 300 | Broadmoor | 70125 | 8 | 9 | 7 | 9 | 7 | -1 | -12.5% | -2 | -22.2% | |||
| 301 | N.O. East Crowder | 70126 | 20 | 16 | 12 | 18 | 19 | -1 | -5.0% | 1 | 5.6% | |||
|---|---|---|---|---|---|---|---|---|---|---|---|---|---|---|
| 302 | N.O. East Crowder to Wright Rd | 70127 | 11 | 18 | 17 | 18 | 16 | 5 | 45.5% | -2 | -11.1% | |||
| 303 | N.O. East Wright Rd to I-510 | 70128 | 9 | 14 | 5 | 11 | 9 | 0 | 0.0% | -2 | -18.2% | |||
| 304 | N.O. East Past I-510 | 70129 | 3 | 9 | 3 | 4 | 5 | 2 | 66.7% | 1 | 25.0% | |||
| 305 | N.O. CBD Lower Garden District | 70130 | 4 | 4 | 6 | 5 | 5 | 1 | 25.0% | 0 | 0.0% | |||
| 306 | Lower Coast Algiers | 70131 | 14 | 19 | 11 | 15 | 16 | 2 | 14.3% | 1 | 6.7% | |||
| 307 | Covington | 70433 | 2 | 1 | 2 | 3 | 5 | 3 | 150.0% | 2 | 66.7% | |||
| 308 | Covington | 70435 | 1 | 0 | 0 | 1 | 2 | 1 | 100.0% | 1 | n/a | |||
| 309 | Mandeville | 70448 | 1 | 2 | 2 | 4 | 1 | 0 | 0.0% | -3 | -75.0% | |||
| 310 | Pearl River | 70452 | 0 | 1 | 1 | 1 | 0 | 0 | n/a | -1 | -100.0% | |||
| 311 | Slidell | 70458 | 2 | 1 | 4 | 6 | 7 | 5 | 250.0% | 1 | 16.7% | |||
| 312 | Slidell | 70460 | 3 | 1 | 2 | 4 | 0 | -3 | -100.0% | -4 | -100.0% | |||
| 313 | Slidell | 70461 | 7 | 5 | 4 | 8 | 3 | -4 | -57.1% | -5 | -62.5% | |||
| 314 | Mandeville | 70471 | 1 | 0 | 2 | 3 | 3 | 2 | 200.0% | 0 | 0.0% | |||
| 315 | Subtotal | 575 | 647 | 582 | 776 | 693 | 118 | 20.5% | -83 | -10.7% | ||||
| 316 | Other Louisiana | 59 | 73 | 67 | 92 | 87 | 28 | 47.5% | -5 | -5.4% | ||||
| 317 | Total Louisiana | 634 | 720 | 649 | 868 | 780 | 146 | 23.0% | -88 | -10.1% | ||||
| 318 | Out-of-State/Unknown | 5 | 2 | 4 | 1 | 6 | 1 | 20.0% | 5 | 500.0% | ||||
| 319 | Total | 639 | 722 | 653 | 869 | 786 | 147 | 23.0% | -83 | -9.6% | ||||
| 320 | ||||||||||||||
| 321 | ||||||||||||||
| 322 | ||||||||||||||
| 323 | ||||||||||||||
| 324 | ||||||||||||||
| 325 | 7/25/2017 | Office of Planning and Research | ||||||||||||
| 326 | ||||||||||||||
| 327 | Spring Enrollment History 2013-2017 by Zip Code (zip code order) | |||||||||||||
| 328 | ||||||||||||||
| 329 | ||||||||||||||
| 330 | ||||||||||||||
| 331 | ||||||||||||||
| 332 | Number | % | Number | % | ||||||||||
| 333 | Change | Change | Change | Change | ||||||||||
| 334 | Sidney Collier Site | Zip | Spring | Spring | Spring | Spring | Spring | 2013 | 2013 | 2016 | 2016 | |||
| 335 | Code | 2013 | 2014 | 2015 | 2016 | 2017 | to 2017 | to 2017 | to 2017 | to 2017 | ||||
| 336 | Metairie S of I-10 | 70001 | 2 | 17 | 17 | 0 | 0.0% | |||||||
| 337 | Metairie | 70002 | 1 | 2 | 2 | 0 | 0.0% | |||||||
| 338 | West Metairie | 70003 | 0 | 11 | 13 | 2 | 18.2% | |||||||
| 339 | Old Metairie-Bucktown | 70005 | 3 | 7 | 3 | -4 | -57.1% | |||||||
| 340 | Metairie Clearview N of I-10 | 70006 | 0 | 7 | 4 | -3 | -42.9% | |||||||
| 341 | Belle Chasse | 70037 | 3 | 5 | 2 | -3 | -60.0% | |||||||
| 342 | Chalmette | 70043 | 7 | 11 | 11 | 0 | 0.0% | |||||||
| 343 | Destrehan | 70047 | 0 | 6 | 4 | -2 | -33.3% | |||||||
| 344 | Gretna | 70053 | 1 | 4 | 6 | 2 | 50.0% | |||||||
| 345 | Gretna/S of Whitney | 70056 | 12 | 25 | 16 | -9 | -36.0% | |||||||
| 346 | Harvey | 70058 | 9 | 25 | 14 | -11 | -44.0% | |||||||
| 347 | South Kenner | 70062 | 1 | 5 | 2 | -3 | -60.0% | |||||||
| 348 | North Kenner | 70065 | 7 | 14 | 12 | -2 | -14.3% | |||||||
| 349 | LaPlace | 70068 | 0 | 4 | 3 | -1 | -25.0% | |||||||
| 350 | Marrero | 70072 | 9 | 26 | 22 | -4 | -15.4% | |||||||
| 351 | Westwego | 70094 | 8 | 13 | 9 | -4 | -30.8% | |||||||
|---|---|---|---|---|---|---|---|---|---|---|---|---|---|---|
| 352 | Algiers | 70114 | 7 | 11 | 8 | -3 | -27.3% | |||||||
| 353 | Uptown | 70115 | 6 | 13 | 8 | -5 | -38.5% | |||||||
| 354 | French Quarter-Marigny | 70116 | 3 | 9 | 2 | -7 | -77.8% | |||||||
| 355 | Bywater/ Lower 9th Ward | 70117 | 25 | 38 | 33 | -5 | -13.2% | |||||||
| 356 | Carrollton/Riverbend | 70118 | 3 | 10 | 6 | -4 | -40.0% | |||||||
| 357 | Mid City | 70119 | 11 | 27 | 26 | -1 | -3.7% | |||||||
| 358 | N.O. Postal Box Zone | 70121 | 2 | 4 | 5 | 1 | 25.0% | |||||||
| 359 | Lakefront/Gentilly | 70122 | 26 | 39 | 33 | -6 | -15.4% | |||||||
| 360 | Harahan-Jefferson | 70123 | 1 | 6 | 3 | -3 | -50.0% | |||||||
| 361 | Lakefront/Lakeview | 70124 | 0 | 7 | 1 | -6 | -85.7% | |||||||
| 362 | Broadmoor | 70125 | 4 | 7 | 10 | 3 | 42.9% | |||||||
| 363 | N.O. East Crowder | 70126 | 49 | 49 | 63 | 14 | 28.6% | |||||||
| 364 | N.O. East Crowder to Wright Rd | 70127 | 40 | 49 | 45 | -4 | -8.2% | |||||||
| 365 | N.O. East Wright Rd to I-510 | 70128 | 13 | 24 | 19 | -5 | -20.8% | |||||||
| 366 | N.O. East Past I-510 | 70129 | 6 | 10 | 10 | 0 | 0.0% | |||||||
| 367 | N.O. CBD Lower Garden District | 70130 | 1 | 3 | 3 | 0 | 0.0% | |||||||
| 368 | Lower Coast Algiers | 70131 | 13 | 20 | 17 | -3 | -15.0% | |||||||
| 369 | Hammond | 70401 | 0 | 0 | 0 | 0 | n/a | |||||||
| 370 | Hammond | 70403 | 0 | 0 | 0 | 0 | n/a | |||||||
| 371 | Abita Springs | 70420 | 0 | 2 | 2 | 0 | 0.0% | |||||||
| 372 | Bogalusa | 70427 | 0 | 0 | 0 | 0 | n/a | |||||||
| 373 | Covington | 70433 | 1 | 1 | 2 | 1 | 100.0% | |||||||
| 374 | Covington | 70435 | 0 | 2 | 1 | -1 | -50.0% | |||||||
| 375 | Lacombe | 70445 | 0 | 0 | 0 | 0 | n/a | |||||||
| 376 | Mandeville | 70448 | 0 | 3 | 6 | 3 | 100.0% | |||||||
| 377 | Pearl River | 70452 | 1 | 1 | 0 | -1 | -100.0% | |||||||
| 378 | Ponchatoula | 70454 | 0 | 2 | 1 | -1 | -50.0% | |||||||
| 379 | Slidell | 70458 | 2 | 12 | 22 | 10 | 83.3% | |||||||
| 380 | Slidell | 70460 | 3 | 8 | 6 | -2 | -25.0% | |||||||
| 381 | Slidell | 70461 | 1 | 6 | 10 | 4 | 66.7% | |||||||
| 382 | Mandeville | 70471 | 0 | 3 | 3 | 0 | 0.0% | |||||||
| 383 | Subtotal | 281 | 548 | 485 | -63 | -11.5% | ||||||||
| 384 | Other Louisiana | 17 | 51 | 46 | -5 | -9.8% | ||||||||
| 385 | Total Louisiana | 298 | 599 | 531 | -68 | -11.4% | ||||||||
| 386 | Out-of-State/Unknown | 1 | 1 | 4 | 3 | 300.0% | ||||||||
| 387 | Total | 299 | 600 | 535 | -65 | -10.8% | ||||||||
| 388 | ||||||||||||||
| 389 | ||||||||||||||
| 390 | ||||||||||||||
| 391 | ||||||||||||||
| 392 | 7/25/2017 | Office of Planning and Research | ||||||||||||
| A | B | C | D | E | F | G | H | I | |
|---|---|---|---|---|---|---|---|---|---|
| 1 | |||||||||
| 2 | |||||||||
| 3 | |||||||||
| 4 | |||||||||
| 5 | |||||||||
| 6 | This publication is only available online. | ||||||||
| 7 | |||||||||
| 8 | Suggested Citation | ||||||||
| 9 | End of Semester Enrollment Report Spring 2017, July 2017. (Office of Planning and Research) Delgado Community College, New Orleans, LA. | ||||||||
| 10 | |||||||||
| 11 | |||||||||
| 12 | Content Contact | ||||||||
| 13 | Brian Auriti, MLIS | ||||||||
| 14 | Research Director, Institutional Research | ||||||||
| 15 | [email protected] | ||||||||
| 16 | |||||||||
| 17 | |||||||||
| 18 | |||||||||
| 19 | |||||||||
| 20 | |||||||||
| 21 | |||||||||
| 22 | The Office of Planning and Research’s staff provide the administration, faculty, and staff with data resources for use in decision making, assessment, and institutional effectiveness initiatives. | ||||||||
| 23 | |||||||||
| 24 | |||||||||
| 25 | Additional resources | ||||||||
| 26 | Statistical Reports in Docushare: | ||||||||
| 27 | http://docushare3.dcc.edu/docushare/dsweb/View/Collection-79 | ||||||||
| 28 | |||||||||
| 29 | Office Webpage: | ||||||||
| 30 | http://www.dcc.edu/departments/ir/ | ||||||||
| 31 | |||||||||
| 32 | |||||||||
| 33 | |||||||||
| 34 | |||||||||
| 35 | |||||||||
| 36 | |||||||||
| 37 | |||||||||
| 38 | |||||||||
| 39 | |||||||||
| 40 | |||||||||
| 41 | |||||||||
| 42 | |||||||||
| 43 | |||||||||
| 44 | |||||||||
| 45 | |||||||||
| 46 | |||||||||
| 47 | 7/12/2016 | Office of Planning and Research | |||||||