1. Cover Page
  2. Table of Contents
  3. Student Demographics
  4. Gen Statistics
  5. Age
  6. Campus&Parish
  7. Adm Status&Class
  8. Division, CourseLocation
  9. Web Classes
  10. TenMajors
  11. Enr By Program
  12. All by Enr
  13. Zip
  14. IR_Page

  A B C D E F G H I J
1
2
3
4
5 Office of Planning & Research
6              
7              
8 Summer 2018
9            
10 End-Of-Semester Enrollment Report
11            
12            
13              
14      
15      
16      
17      
18      
19      
20      
21      
22      
23      
24      
25      
26      
27      
28      
29      
30      
31      
32      
33      
34      
35      
36      
37                    
38    
39        
40    
41        
42        
43      
44                    
45                    
46
47 Prepared by the Office of Planning & Research
48 8/28/2018

Back to top


  A B C D E F G H I J
1
2 Table of Contents
3                    
4                    
5                    
6          
7                    
8                    
9                    
10             page no.    
11                    
12   Student Demographics         1    
13     Gender              
14     Ethnicity              
15                    
16   General Statistics         2    
17     Full-time/Part-time Status            
18     Scheduled Credit Hours/ FTE's            
19                    
20   Enrollment by Age         3    
21                    
22   Enrollment by Campus         4    
23                    
24   Enrollment by Parish         4    
25                    
26   Enrollment by Admission Status       5    
27                    
28   Enrollment by Classification       5    
29                    
30   Enrollment by Division         6    
31                    
32   Enrollment by Award         6    
33                    
34   Enrollment by Course Location, SCH     7    
35                    
36   Enrollment by Online Status       8    
37                    
38   Top Ten Most Popular Majors       9    
39                    
40   Two Year Comparison of College-wide Enrollment by Program 10    
41                  
42   Enrollment by Program - ranked by enrollment   12    
43                    
44   Enrollment by Zip Code         14    
45                  
46                  
47                  
48                    
49                  
50                  
51
52 8/28/2018 OPR

Back to top


  A B C D E F G H I J K M
1  
2 Student Demographics
3                        
4    
5    
6    
7    
8    
9    
10    
11    
12    
13    
14    
15    
16                        
17                        
18  
19  
20  
21  
22  
23  
24  
25  
26  
27  
28  
29  
30  
31  
32  
33  
34  
35  
36  
37                        
38                        
39   Summer 2017 Summer 2018 Inc/Dec % Change  
40   Number Percent Number Percent Number Percent  
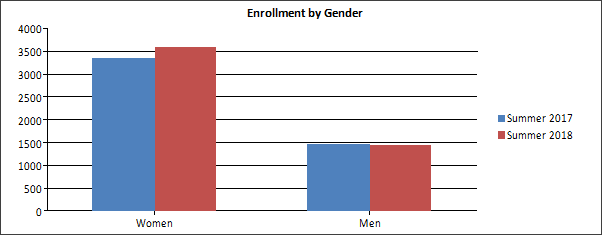
41   Women 3,343 69% 3,599 71% 256 7.7%  
42   Men 1,472 31% 1,449 29% -23 -1.6%  
43  
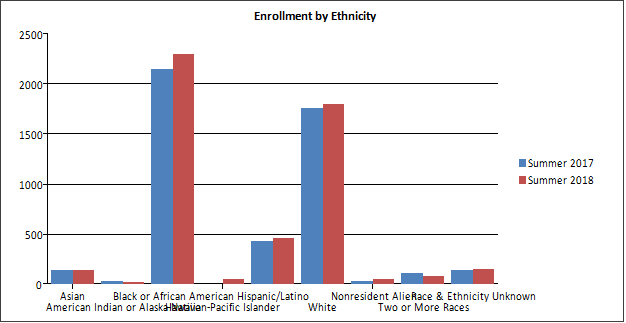
44   Asian 145 3% 138 3% -7 -4.8%  
45   American Indian or Alaska Native 30 1% 20 0% -10 -33.3%  
46   Black or African American 2,153 45% 2,296 45% 143 6.6%  
47   Hawaiian-Pacific Islander 5 0% 55 1% 50 1000.0%  
48   Hispanic/Latino 433 9% 462 9% 29 6.7%  
49   White 1,760 37% 1,797 36% 37 2.1%  
50   Nonresident Alien 35 1% 47 1% 12 34.3%  
51   Two or More Races 109 2% 81 2% -28 -25.7%  
52   Race & Ethnicity Unknown 145 3% 152 3% 7 4.8%  
53   Total 4,815 100% 5,048 100% 233 4.8%  
54                    
55  
56 8/28/2018 OPR  

Back to top


  A B C D E F G H I J K L
1    
2 General Statistics    
3                        
4    
5    
6    
7    
8    
9    
10    
11    
12    
13    
14    
15    
16    
17    
18    
19    
20    
21                        
22    
23    
24    
25    
26    
27    
28    
29    
30    
31    
32    
33    
34    
35    
36    
37    
38    
39    
40                        
41                        
42                        
43   Summer 2017 Summer 2018 Inc/Dec % Change    
44   Number Percent Number Percent Number Percent    
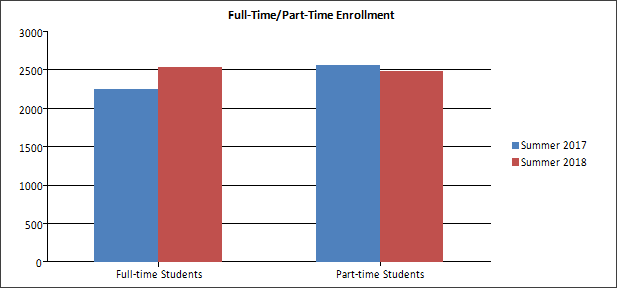
45   Full-time Students 2,251 47% 2,551 51% 300 13.3%    
46   Part-time Students 2,564 53% 2,497 49% -67 -2.6%    
47        
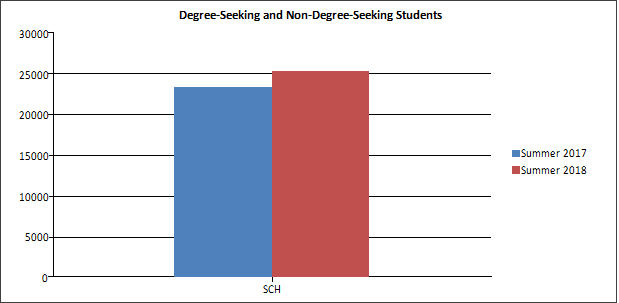
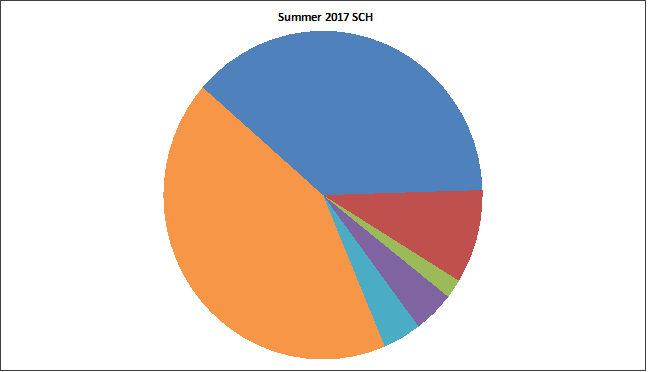
48   SCH 23,247 25,124 1,877 8.1%    
49   FTE Other (based on 6 SCH) 3,875   4,187 313 8.1%    
50   Total Credit Enrollment 4,815 100% 5,048 100% 233 4.8%    
51                        
52                    
53                      
54    
55 8/28/2018 OPR    

Back to top


  A B C D E F G H I J
1
2 Enrollment by Age
3                    
4                    
5                    
6
7
8
9
10
11
12
13
14
15
16
17
18
19
20
21
22
23
24
25
26
27
28
29                    
30                    
31                    
32                    
33                
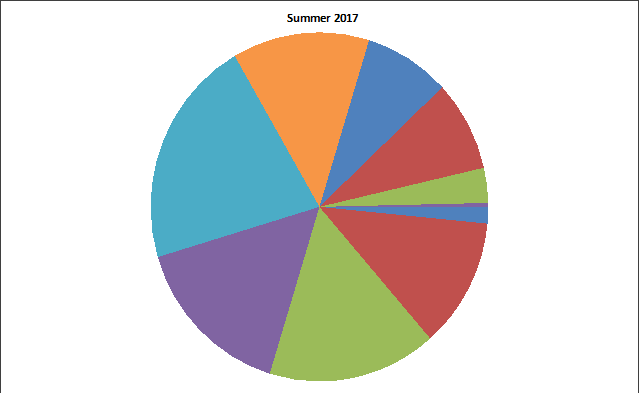
34   Age Summer 2017 Summer 2018 Inc/Dec %Change
35   Number Percent Number Percent Number Percent
36   Under 18 65 1% 78 2% 13 20.0%
37   18 – 19 655 14% 609 12% -46 -7.0%
38   20 – 21 719 15% 816 16% 97 13.5%
39   22 – 24 765 16% 786 16% 21 2.7%
40   25 – 29 1,040 22% 1,074 21% 34 3.3%
41   30 – 34 630 13% 663 13% 33 5.2%
42   35 – 39 410 9% 415 8% 5 1.2%
43   40 – 49 362 8% 425 8% 63 17.4%
44   50 – 64 154 3% 164 3% 10 6.5%
45   65 and over 15 0% 18 0% 3 20.0%
46   Total 4,815 100% 5,048 100% 233 4.8%
47   Average Age 28.0 27.8    
48              
49                    
50                  
51                  
52                    
53                  
54
55 8/28/2018 OPR
56                  

Back to top


  A B C D E F G H I J K
1  
2 Enrollment by Campus & Parish  
3  
4  
5  
6  
7  
8  
9  
10  
11  
12  
13  
14  
15  
16                      
17  
18
19
20
21
22
23
24
25
26
27
28
29
30                    
31   Campus Summer 2017 Summer 2018 Inc/Dec %Change
32   Number Percent Number Percent Number Percent
33   City Park Campus 3,362 70% 3,415 68% 53 1.6%  
34   West Bank Campus 639 13% 788 16% 149 23.3%  
35   Charity School of Nursing 334 7% 306 6% -28 -8.4%  
36   Sidney Collier 236 5% 261 5% 25 10.6%  
37   Technical Site - Jefferson 244 5% 278 6% 34 13.9%  
38   Total 4,815 100% 5,048 100% 233 4.8%  
39    
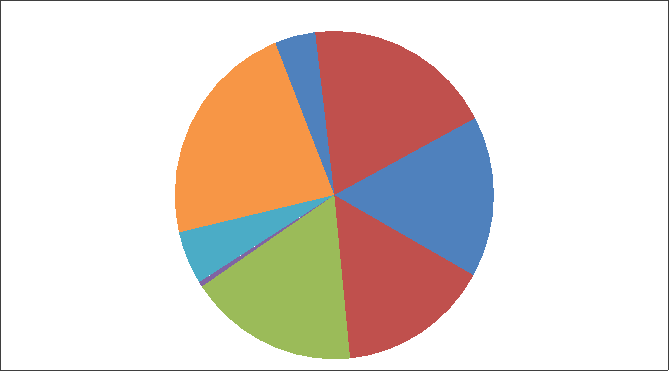
40   Top Ten Parishes Summer 2017 Summer 2018 Inc/Dec %Change  
41   Number Percent Number Percent Number Percent  
42   Orleans 1,795 37% 1,830 36% 35 1.9%  
43   Jefferson 1,578 33% 1,704 34% 126 8.0%  
44   St. Tammany 507 11% 481 10% -26 -5.1%  
45   St. Charles 175 4% 187 4% 12 6.9%  
46   St. John 112 2% 135 3% 23 20.5%  
47   St. Bernard 83 2% 79 2% -4 -4.8%  
48   Plaquemines 76 2% 93 2% 17 22.4%  
49   Tangipahoa 64 1% 64 1% 0 0.0%  
50   E. Baton Rouge 45 1% 54 1% 9 20.0%  
51   Terrebonne 40 1% 49 1% 9 22.5%  
52   Other 340 7% 372 7% 32 9.4%  
53   Total 4,815 100% 5,048 100% 233 4.8%  
54                    
55  
56 8/28/2018 OPR  

Back to top


  A B C D E F G H I J L
1  
2 Enrollment by Admission Status & Classification  
3                  
4  
5  
6  
7  
8  
9  
10  
11  
12  
13  
14  
15  
16  
17  
18  
19  
20  
21  
22  
23  
24  
25  
26  
27  
28  
29  
30  
31  
32  
33  
34                      
35                      
36                  
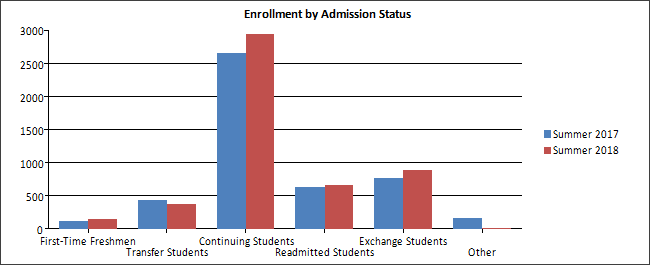
37   Admission Status Summer 2017 Summer 2018 Inc/Dec %Change  
38   Number Percent Number Percent Number Percent  
39   First-Time Freshmen 130 3% 154 3% 24 18.5%  
40   Transfer Students 437 9% 372 7% -65 -14.9%  
41   Continuing Students 2,667 55% 2,946 58% 279 10.5%  
42   Readmitted Students 636 13% 668 13% 32 5.0%  
43   Exchange Students 775 16% 890 18% 115 14.8%  
44   Other 170 4% 18 0% -152 -89.4%  
45   Total 4,815 100% 5,048 100% 233 4.8%  
46    
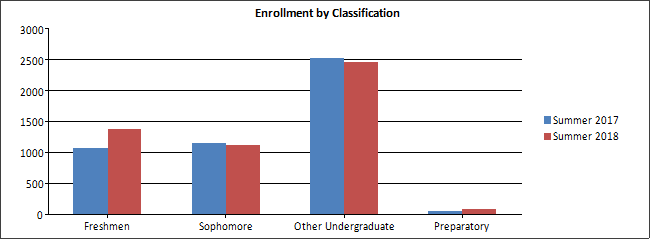
47   Classification Summer 2017 Summer 2018 Inc/Dec %Change  
48   Number Percent Number Percent Number Percent  
49   Freshmen 1,080 22% 1,381 27% 301 27.9%  
50   Sophomore 1,158 24% 1,125 22% -33 -2.8%  
51   Other Undergraduate 2,523 52% 2,462 49% -61 -2.4%  
52   Preparatory 54 1% 80 2% 26 48.1%  
53   Total 4,815 100% 5,048 100% 233 4.8%  
54    
55  
56 8/28/2018 OPR  
57                      

Back to top


  A B C D E F G H I J K L M
1    
2 Enrollment by Division & Award    
3                          
4                          
5                          
6    
7    
8    
9    
10    
11    
12    
13    
14    
15    
16    
17  
18    
19    
20    
21    
22    
23    
24    
25    
26    
27    
28        
29        
30                          
31            
32   Division Summer 2016 Summer 2017 Inc/Dec %Change    
33   Number Percent Number Percent Number Percent    
34   Allied Health 795 17% 803 16% 8 1.0%    
35   Arts & Humanities 805 17% 772 15% -33 -4.1%    
36   Business & Technology 807 17% 866 17% 59 7.3%    
37   Communication 26 1% 26 1% 0 0.0%    
38   Nursing 328 7% 265 5% -63 -19.2%    
39   Science & Math 771 16% 1,141 23% 370 48.0%  
40   Technical 161 3% 208 4% 47 29.2%  
41   No College Designated 1,122 23% 967 19% -155 -13.8%  
42   College Total 4,815 100% 5,048 100% 233 4.8%    
43        
44                      
45      
46   Award Summer 2016 Summer 2017 Inc/Dec %Change    
47   Number Percent Number Percent Number Percent    
48   Associate 3224 67% 3322 66% 98 3.0%    
49   Post-Associate Certificate 60 1% 79 2% 19 31.7%    
50   Certificate 358 7% 370 7% 12 3.4%    
51   Diploma 202 4% 230 5% 28 13.9%    
52   Non-degree seeking 971 20% 1047 21% 76 7.8%    
53   College Total 4,815 100% 5,048 100% 233 4.8%    
54                
55      
56      
57    
58 8/14/2017 OPR    
59    
60    
61 Enrollment by Course Location/Class Campus
62                          
63    
64   Course Location Enrollment Summer 2017 Summer 2018 Inc/Dec %Change    
65   Number Percent Number Percent Number Percent    
66   City Park Campus 2,205 39% 2,264 38% 59 2.7%    
67   West Bank Campus 676 12% 686 11% 10 1.5%    
68   Charity School of Nursing 190 3% 139 2% -51 -26.8%    
69   Sidney Collier Site 258 5% 217 4% -41 -15.9%    
70   Technical Site - Jefferson 142 3% 164 3% 22 15.5%    
71 Online 2,153 38% 2,535 42% 382 17.7%    
72 Offsite 0 0% 0 0% 0 N/A    
73   College Total 5,624 100% 6,005 100% 381 6.8%    
74 Note: Students may enroll courses on different locations, the combined figure is more than headcount total.      
75                          
76    
77    
78      
79      
80      
81      
82      
83      
84      
85      
86      
87      
88      
89      
90      
91      
92      
93      
94      
95      
96      
97      
98      
99    
100   Course Location SCH Summer 2017 Summer 2018 Inc/Dec %Change    
101   Number Percent Number Percent Number Percent    
102   City Park Campus 9,259 40% 9,578 38% 319 3.4%    
103   West Bank Campus 2,332 10% 2,322 9% -10 -0.4%    
104   Charity School of Nursing 613 3% 474 2% -139 -22.7%    
105 Sidney Collier 1,126 5% 1,039 4% -87 -7.7%    
106 Technical Site - Jefferson 935 4% 978 4% 43 4.6%    
107   Online 8,979 39% 10,733 43% 1,754 19.5%    
108   Offsite 0 0% 0 0% 0 N/A    
109   College Total 23,244 100% 25,124 100% 1,880 8.1%    
110    
111      
112    
113 8/28/2018 OPR    

Back to top


  A B C D E F G H I J K
1    
2 Enrollment by Online Status    
3    
4 Collegewide Summer 2017 Summer 2018 Inc/Dec % Chg    
5 Number Percent Number Percent    
6 No. of students taking a web class ¹ 2,153 44.7%   2,529 50.1%   376 17.5%    
7 Students taking only web classes 1,444 30.0%   1,692 33.5%   248 17.2%    
8 Average no. of web courses taken 1.44   1.46   0.02 1.4%    
9 Students in only Face to Face classes² 2,662 55.3%   2,519 49.9%   -143 -5.4%    
10 Total of 1 & 2 4,815 100.0%   5,048 100.0%   233 4.8%    
11        
12          
13 City Park          
14 No. of students taking a web class ¹ 1,563 46.5%   1,698 49.7%   135 8.6%    
15 Students taking only web classes 1,085 32.3%   1,170 34.3%   85 7.8%    
16 Average no. of web courses taken 1.48   1.48   0.00 0.0%    
17 Students in only Face to Face classes² 1,799 53.5%   1,717 50.3%   -82 -4.6%    
18 Total of 1 & 2 3,362 100.0%   3,415 100.0%   53 1.6%    
19        
20        
21 West Bank    
22 No. of students taking a web class ¹ 282 44.1%   410 52.0%   128 45.4%    
23 Students taking only web classes 191 29.9%   264 33.5%   73 38.2%    
24 Average no. of web courses taken 1.51   1.57   0.06 4.0%    
25 Students in only Face to Face classes² 357 55.9%   378 48.0%   21 5.9%    
26 Total of 1 & 2 639 100.0%   788 100.0%   149 23.3%    
27        
28          
29 Charity School of Nursing    
30 No. of students taking a web class ¹ 199 59.6%   230 75.2%   31 15.6%    
31 Students taking only web classes 116 34.7%   151 49.3%   35 30.2%    
32 Average no. of web courses taken 1.06   1.16   0.10 9.4%    
33 Students in only Face to Face classes² 135 40.4%   76 24.8%   -59 -43.7%    
34 Total of 1 & 2 334 100.0%   306 100.0%   -28 -8.4%    
35        
36        
37 Technical Site - Jefferson    
38 No. of students taking a web class ¹ 61 25.0% 100 36.0% 39 63.9%    
39 Students taking only web classes 38 15.6%   65 23.4% 27 71.1%  
40 Average no. of web courses taken 1.48   1.35 -0.13 -8.8%  
41 Students in only Face to Face classes² 183 75.0%   178 64.0% -5 -2.7%  
42 Total of 1 & 2 244 100.0%   278 100.0% 34 13.9%  
43                      
44                  
45 Sidney Collier    
46 No. of students taking a web class ¹ 48 20.3% 91 43 89.6%    
47 Students taking only web classes 24 10.2%   42 18 75.0%  
48 Average no. of web courses taken 1.35   1.32 -0.03 -2.2%  
49 Students in only Face to Face classes² 188 79.7%   170 -18 -9.6%  
50 Total of 1 & 2 236 100.0%   261 100.0% 25 10.6%  
51                      
52                  
53  
54 8/28/2018 OPR  

Back to top


  A B C D E F G H I J K
1    
2 Top Ten Most Popular Majors    
3                    
4                      
5      
6      
7      
8      
9      
10      
11      
12      
13      
14      
15
16
17
18
19
20
21
22
23
24
25
26
27      
28      
29      
30      
31                      
32                  
33 Top Ten Most Popular Majors    
34   Summer 2017 Summer 2018      
35   Number Percent Number Percent   CIP6  
36   Nursing - Registered Nursing 944 20% 1,021 20%   513801-1  
37   General Studies 575 12% 551 11%   240102-1  
38   Business & Management   184 4% 213 4%   520201-2  
39   Business Administration 185 4% 211 4%   520101-3  
40   Radiologic Technology - Radiographer 164 3% 163 3%   510911-2  
41   Transfer Degree - A.A. & A.S.   153 3% 163 3%   240199-2/3  
42   Nursing - Practical Nursing 138 3% 138 3%   513901-1  
43   Criminal Justice 97 2% 117 2%   430107-1  
44   Accounting 81 2% 106 2%     520302-3  
45   Physical Therapist Assistant   80 2% 86 2%   510806-1  
46   Other Majors 2,214 46% 2,279 45%    
47   Total 4,815 100% 5,048 100%      
48            
49                  
50    
51 8/28/2018 OPR    

Back to top


  A B C D E F G H
1    
2 College-wide Enrollment by Program    
3                
4 Programs of Study Summer Inc/Dec Percent Change    
5 2017 2018    
6 English as a Second Language - DEG 5 8   3 60%    
7 English as a Second Language - NODEG 2 0   -2 -100%    
8 Non-degree Seeking, No Major 908 886   -22 -2%    
9 Non-degree: Dual Enrollment 54 81   27 50%    
10 Uncommitted Students 969 975 6 1%  
11 Horticulture Technology 4 0 -4 -100%    
12 Agriculture & Operations 4 0 -4 -100%    
13 Performance & Media Arts 0 0 0 na    
14 Communication, Journalism 0 0 0 na    
15 Computer Information Technology 78 67 -11 -14%    
16 Computer Network Technology 45 32 -13 -29%    
17 Web Site Design 6 5 -1 -17%    
18 Computer & Information Sciences 129 104 -25 -19%    
19 Barber-Styling 23 30 7 30%    
20 Cosmetology 34 43 9 26%    
21 Culinary Arts 43 40 -3 -7%    
22 Culinary Management 2 0 -2 -100%    
23 Funeral Service Education 31 29 -2 -6%    
24 Pastry Arts 3 6 3 100%    
25 Personal & Culinary Services 136 148   12 9%    
26 Teaching Grades 1-5 28 56 28 100%    
27 Education 28 56   28 100%    
28 Architectural/Design Construction Technology 15 20   5 33%    
29 Civil & Construction Applied Engineering Technology 10 14 4 40%    
30 Computer Aided Design & Drafting 16 20 4 25%    
31 Electrical-Electronics Engineering Technology 48 40 -8 -17%    
32 Electronics Service Technology 3 4 1 33%    
33 Engineering Technologies 92 98   6 7%    
34 American Sign Language Interpreting 26 18 -8 -31%    
35 Foreign Languages, Literatures 26 18 -8 -31%    
36 Care & Development of Young Children 57 85 28 49%    
37 Family & Consumer/Human Sciences 57 85   28 49%    
38 Legal Secretary 0 2 2 na    
39 Legal Professions & Studies 0 2   2 na    
40 General Studies 575 551 -24 -4%    
41 Transfer Degree - A.A. 71 73 2 3%    
42 Transfer Degree - A.S. 82 90 8 10%    
43 Liberal Arts & Sciences, General Studies 728 714   -14 -2%    
44 Science Laboratory Technology 17 12 -5 -29%    
45 Science Technologies/Technicians 17 12 -5 -29%    
46 Criminal Justice 97 117 20 21%    
47 Fire Science Technology 23 23 0 0%    
48 Homeland Security, Law Enforcement, Firefighting 120 140 20 17%    
49 Carpentry 8 12 4 50%    
50 Electric Line Technician 0 0 0 na    
51 Electrical Technology 0 0 0 na    
52 Electrician: Commercial 1 1 0 0%    
53 Electrician: Residential 20 22 2 10%    
54 Electrician: Small Industrial 0 2 2 na    
55 Marine/Maintenance Electrical Apprentice 0 1 1 na    
56 Pipefitter Apprentice 0 0 0 na    
57 Painter Apprentice 0 0 0 na    
58 Construction Trades 29 38   9 31%    
59    
60 8/28/2018 OPR    
61      
62    
63 College-wide Enrollment by Program (cont.)    
64      
65 Programs of Study Summer Inc/ Percent    
66 2017 2018 Dec Change    
67 (Air-Conditioning) Certified HVAC Technician 16 25 9 56%    
68 (Air-Conditioning) Master HVAC/R Technician 7 19 12 171%    
69 Computer & Electronics Service Technology 8 6 -2 -25%    
70 Industrial Maintenance Technology 2 1 -1 -50%    
71 Motor Vehicle Technology 21 28 7 33%    
72 Mechanic & Repair Technologies 54 79   25 46%    
73 Machine Tool Technology 0 3 3 na    
74 Precision Machining 2 0 -2 -100%    
75 Welding 27 20 -7 -26%    
76 Precision Production 29 23   -6 -21%    
77 Digital Photography 0 2 2 na    
78 Fine Arts 0 0 0 na    
79 Interior Design 13 3 -10 -77%  
80 Kitchen and Bath Design 3 0 -3 -100%  
81 Visual Communications-Graphic Design 32 33 1 3%    
82 Visual & Performing Arts 48 36 -12 -25%    
83 Diagnostic Medical Sonography 38 42 4 11%    
84 Dietary Manager 1 0 -1 na    
85 Dietetics Technician 14 2 -12 -86%    
86 Emergency Medical Technician-Paramedic 36 30 -6 -17%    
87 Health Information Technology 33 45 12 36%  
88 Massage Therapy 21 14 -7 -33%    
89 Medical Coding 46 49 3 7%  
90 Medical Laboratory Technician 48 47 -1 -2%    
91 Medical Registration Specialist 8 6 -2 -25%    
92 Nuclear Medicine Technology 8 13 5 63%    
93 Nursing - Practical Nursing 138 138 0 0%    
94 Nursing - Registered Nursing 944 1,021 77 8%    
95 Occupational Therapy Assistant 52 48 -4 -8%    
96 Ophthalmic Medical Assistant 4 1 -3 -75%    
97 Pharmacy Technician 40 44 4 10%    
98 Physical Therapy Assistant 80 86 6 7%    
99 Polysomnographic Technology 12 14 2 17%    
100 Radiation Therapy 14 24 10 71%    
101 Radiologic Technology 164 163 -1 -1%    
102 Respiratory Care Technology 56 52 -4 -7%    
103 Surgical Technology 50 53 3 6%    
104 Veterinary Technology 39 41 2 5%    
105 Health Professions & Programs 1,846 1,933 87 5%    
106 Accounting 81 106 25 31%  
107 Accounting Technology: Account Clerk 18 13 -5 -28%  
108 Administrative Office Technology 0 0 0 na    
109 Business & Management 184 213 29 16%    
110 Business Administration 185 211 26 14%    
111 Entrepreneurship 9 13 4 44%    
112 Hospitality Management 26 23 -3 -12%    
113 Logistics Technology 0 2 2 na    
114 Real Estate 0 5 5 na    
115 Business, Management, Marketing 503 586 83 17%    
116 Total 4,815 5,048 233 5%    
117                
118                
119    
120 8/28/2018 OPR    

Back to top


  A B C D
1
2 Enrollment by Program - Ranked by Enrollment
3
4 Programs of Study Summer 2018
5 Number Percent
6 Nursing - Registered Nursing 1,021 20.2%
7 Non-degree Seeking, No Major 886 17.5%
8 General Studies 551 10.9%
9 Business & Management 213 4.2%
10 Business Administration 211 4.2%
11 Radiologic Technology 163 3.2%
12 Nursing - Practical Nursing 138 2.7%
13 Criminal Justice 117 2.3%
14 Accounting 106 2.1%
15 Transfer Degree - A.S. 90 1.8%
16 Physical Therapy Assistant 86 1.7%
17 Care & Development of Young Children 85 1.7%
18 Non-degree: Dual Enrollment 81 1.6%
19 Transfer Degree - A.A. 73 1.4%
20 Computer Information Technology 67 1.3%
21 Teaching Grades 1-5 56 1.1%
22 Surgical Technology 53 1.0%
23 Respiratory Care Technology 52 1.0%
24 Medical Coding 49 1.0%
25 Occupational Therapy Assistant 48 1.0%
26 Medical Laboratory Technician 47 0.9%
27 Health Information Technology 45 0.9%
28 Pharmacy Technician 44 0.9%
29 Cosmetology 43 0.9%
30 Diagnostic Medical Sonography 42 0.8%
31 Veterinary Technology 41 0.8%
32 Culinary Arts 40 0.8%
33 Electrical-Electronics Engineering Technology 40 0.8%
34 Visual Communications-Graphic Design 33 0.7%
35 Computer Network Technology 32 0.6%
36 Barber-Styling 30 0.6%
37 Emergency Medical Technician-Paramedic 30 0.6%
38 Funeral Service Education 29 0.6%
39 Motor Vehicle Technology 28 0.6%
40 (Air-Conditioning) Certified HVAC Technician 25 0.5%
41 Radiation Therapy 24 0.5%
42 Fire Science Technology 23 0.5%
43 Hospitality Management 23 0.5%
44 Electrician: Residential 22 0.4%
45 Architectural/Design Construction Technology 20 0.4%
46 Computer Aided Design & Drafting 20 0.4%
47 Welding 20 0.4%
48 (Air-Conditioning) Master HVAC/R Technician 19 0.4%
49 American Sign Language Interpreting 18 0.4%
50 Civil & Construction Applied Engineering Technology 14 0.3%
51 Massage Therapy 14 0.3%
52 Polysomnographic Technology 14 0.3%
53  
54
55 8/28/2018 OPR
56        
57        
58
59 Enrollment by Program - Ranked by Enrollment (cont.)
60  
61
62 Programs of Study Summer 2018
63 Number Percent
64 Nuclear Medicine Technology 13 0.3%
65 Accounting Technology: Account Clerk 13 0.3%
66 Entrepreneurship 13 0.3%
67 Science Laboratory Technology 12 0.2%
68 Carpentry 12 0.2%
69 English as a Second Language - DEG 8 0.2%
70 Pastry Arts 6 0.1%
71 Computer & Electronics Service Technology 6 0.1%
72 Medical Registration Specialist 6 0.1%
73 Web Site Design 5 0.1%
74 Real Estate 5 0.1%
75 Electronics Service Technology 4 0.1%
76 Machine Tool Technology 3 0.1%
77 Interior Design 3 0.1%
78 Legal Secretary 2 0.0%
79 Electrician: Small Industrial 2 0.0%
80 Digital Photography 2 0.0%
81 Dietetics Technician 2 0.0%
82 Logistics Technology 2 0.0%
83 Electrician: Commercial 1 0.0%
84 Marine/Maintenance Electrical Apprentice 1 0.0%
85 Industrial Maintenance Technology 1 0.0%
86 Ophthalmic Medical Assistant 1 0.0%
87  
88  
89  
90  
91  
92  
93  
94  
95  
96  
97  
98  
99  
100  
101  
102 Total 5,049 100%
103
104
105
106
107
108
109
110
111
112
113 8/28/2018 OPR

Back to top


  A B C D E F G H
1
2 Enrollment by Zip Code
3
4 Zip Code Summer 2017 Percent Summer 2018 Percent Inc/Dec %Change
5 Metairie S of I-10 70001 181 4% 164 4% -17 -9%
6 Metairie 70002 74 2% 57 1% -17 -23%
7 West Metairie 70003 176 4% 162 4% -14 -8%
8 Old Metairie-Bucktown 70005 105 2% 79 2% -26 -25%
9 Metairie Clearview N of I-10 70006 65 2% 62 1% -3 -5%
10 Belle Chasse 70037 60 1% 74 2% 14 23%
11 Chalmette 70043 57 1% 59 1% 2 4%
12 Destrehan 70047 46 1% 44 1% -2 -4%
13 Gretna 70053 50 1% 56 1% 6 12%
14 Gretna/S of Whitney 70056 213 5% 231 5% 18 8%
15 Harvey 70058 205 5% 232 5% 27 13%
16 South Kenner 70062 54 1% 63 1% 9 17%
17 North Kenner 70065 206 5% 231 5% 25 12%
18 LaPlace 70068 107 3% 122 3% 15 14%
19 Luling 70070 43 1% 48 1% 5 12%
20 Marrero 70072 249 6% 283 6% 34 14%
21 Saint Rose 70087 30 1% 44 1% 14 47%
22 Westwego 70094 112 3% 140 3% 28 25%
23 Algiers 70114 89 2% 118 3% 29 33%
24 Uptown 70115 79 2% 95 2% 16 20%
25 French Quarter-Marigny 70116 36 1% 30 1% -6 -17%
26 Bywater/Lower 9th Ward 70117 115 3% 126 3% 11 10%
27 Carrollton/Riverbend 70118 95 2% 102 2% 7 7%
28 Mid City 70119 172 4% 175 4% 3 2%
29 N.O. Postal Box Zone 70121 35 1% 48 1% 13 37%
30 Lakefront/Gentilly 70122 171 4% 201 5% 30 18%
31 Harahan-Jefferson 70123 117 3% 140 3% 23 20%
32 Lakefront/Lakeview 70124 70 2% 77 2% 7 10%
33 Broadmoor 70125 80 2% 56 1% -24 -30%
34 N.O. East Crowder 70126 165 4% 180 4% 15 9%
35 N.O. East Crowder to Wright Rd 70127 121 3% 102 2% -19 -16%
36 N.O. East Wright Rd to I-510 70128 106 2% 109 2% 3 3%
37 N.O. East Past I-510 70129 28 1% 35 1% 7 25%
38 N.O. CBD-Lwr Garden District 70130 43 1% 35 1% -8 -19%
39 Lower Coast Algiers 70131 166 4% 163 4% -3 -2%
40 Hammond 70401 14 0% 12 0% -2 -14%
41 Abita Springs 70420 9 0% 14 0% 5 56%
42 Covington 70433 71 2% 67 2% -4 -6%
43 Covington 70435 32 1% 22 0% -10 -31%
44 Lacombe 70445 16 0% 15 0% -1 -6%
45 Mandeville 70448 46 1% 42 1% -4 -9%
46 Pearl River 70452 25 1% 30 1% 5 20%
47 Ponchatoula 70454 21 0% 23 1% 2 10%
48 Slidell 70458 108 3% 93 2% -15 -14%
49 Slidell 70460 65 2% 47 1% -18 -28%
50 Slidell 70461 104 2% 99 2% -5 -5%
51 Mandeville 70471 44 1% 37 1% -7 -16%
52 Subtotal 4,276 88.8% 4,444 88.0% 168 4%
53 Other Louisiana 502 10.4% 557 11.0% 55 11%
54 Total Louisiana 4,778 99.2% 5,001 99.1% 223 5%
55 Out-of-State 37 0.8% 47 0.9% 10 27%
56 Total 4,815 100% 5,048 100% 233 5%
57            
58
59 8/28/2018 OPR
60  
61              
62                
63              
64              
65              
66              
67              
68              
69              
70              
71              
72              
73              
74              
75              
76              
77              
78              
79              
80              
81              
82              
83              
84              
85              
86              
87              
88              
89              
90              
91              
92              
93              
94              
95              
96              
97              
98              
99              
100              
101              
102              
103              
104              
105              
106              
107              
108              
109              
110              
111              
112              
113              
114              
115              
116              
117              
118              
119              
120              
121              
122              
123              
124              
125              
126              
127              
128              
129              
130              
131              
132              
133              
134              
135              
136              
137              
138              
139              
140              
141              
142              
143              
144              
145              
146              
147              
148              
149              
150              
151              
152              
153              
154              
155              
156              
157              
158              
159              
160              
161              
162              
163              
164              
165              
166              
167              
168              
169              
170              
171              
172              
173              
174              
175              
176              
177              
178              
179              
180              
181              
182              
183              
184              
185              
186              
187              
188              
189              
190              
191              
192              
193              
194              
195              
196              
197              
198              
199              
200              
201              
202              
203              
204              
205              
206              
207              
208              
209              
210              
211              
212              
213              
214              
215              
216              
217              
218              
219              
220              
221              
222              

Back to top


  A B C D E F G H I
1  
2  
3  
4  
5                  
6 This publication is only available online.  
7                
8 Suggested Citation            
9 End-Of-Semester Enrollment Report Summer 2018, August 2018. (Office of Planning and Research) Delgado Community College, New Orleans.  
10  
11                  
12 Content Contact              
13 Brian Auriti, MLIS            
14 Research Manager            
15 baurit@dcc.edu              
16                
17                
18                
19                  
20                
21                
22 The Office of Planning and Research’s staff provide the administration, faculty, and staff with data resources for use in decision making, assessment, and institutional effectiveness initiatives.  
23  
24  
25 Additional resources            
26 Statistical Reports in Docushare:            
27 http://docushare3.dcc.edu/docushare/dsweb/View/Collection-79          
28                
29 Office Webpage:              
30 http://www.dcc.edu/departments/ir/            
31                  
32                  
33                  
34                  
35                  
36                  
37                  
38                  
39                  
40                  
41                  
42                  
43                  
44    
45  
46 8/28/2018 Office of Planning and Research  

Back to top